
House Prices in Head Crag
House prices in Head Crag have an overall average of £284,227 over the last year.
The majority of properties sold in Head Crag during the last year were terraced properties, selling for an average price of £225,500. Detached properties sold for an average of £362,500, with semi-detached properties fetching £274,500.
Overall, the historical sold prices in Head Crag over the last year were 12% up on the previous year and 2% up on the 2023 peak of £279,125.
Properties Sold
21, Burlington Close, Kirkby-in-furness LA17 7UG
| Today | See what it's worth now |
| 24 Apr 2026 | £139,000 |
| 30 May 2003 | £60,000 |
No other historical records.
The Punch Bowl, Beckside, Kirkby-in-furness LA17 7TG
| Today | See what it's worth now |
| 17 Mar 2026 | £165,000 |
| 30 Jun 1998 | £72,500 |
No other historical records.
Copp Cross, Kirkby In Furness, Kirkby-in-furness LA17 7XZ
| Today | See what it's worth now |
| 15 Jan 2026 | £520,000 |
No other historical records.
Church Cottage, Beckside, Kirkby-in-furness LA17 7TQ
| Today | See what it's worth now |
| 27 Nov 2025 | £260,000 |
| 14 Jun 2021 | £135,000 |
6, Herschell Terrace, School Road, Kirkby-in-furness LA17 7TL
| Today | See what it's worth now |
| 13 Nov 2025 | £185,000 |
| 15 Jan 2019 | £143,000 |
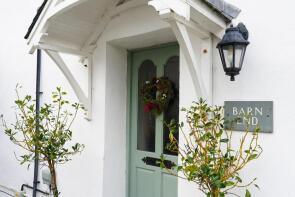
Barn End, Soutergate, Kirkby-in-furness LA17 7TW
| Today | See what it's worth now |
| 23 Oct 2025 | £410,000 |
| 26 Mar 2008 | £312,000 |
Aurora, Askew Gate Brow, Kirkby-in-furness LA17 7TE
| Today | See what it's worth now |
| 19 Aug 2025 | £370,000 |
| 8 May 2008 | £340,000 |
10, Long Row, Kirkby-in-furness LA17 7UP
| Today | See what it's worth now |
| 31 Jul 2025 | £235,000 |
| 29 Jul 2013 | £162,500 |
5, Long Row, Kirkby-in-furness LA17 7UP
| Today | See what it's worth now |
| 28 Jul 2025 | £242,500 |
| 19 Dec 2016 | £120,000 |
No other historical records.
3, Beckside Cottages, Beckside, Kirkby-in-furness LA17 7TQ
| Today | See what it's worth now |
| 21 Jul 2025 | £300,000 |
| 1 Oct 2004 | £180,000 |
Dow Cragg, Kirkby In Furness, Kirkby-in-furness LA17 7UJ
| Today | See what it's worth now |
| 1 Jul 2025 | £300,000 |
No other historical records.
Laburnum Cottage, School Road, Kirkby-in-furness LA17 7TL
| Today | See what it's worth now |
| 26 Jun 2025 | £250,000 |
No other historical records.
Bridge End Farm, Soutergate, Kirkby-in-furness LA17 7TW
| Today | See what it's worth now |
| 20 Jun 2025 | £248,000 |
No other historical records.
24, Burlington Close, Kirkby-in-furness LA17 7UG
| Today | See what it's worth now |
| 13 Jun 2025 | £120,000 |
No other historical records.
1, Long Row, Kirkby-in-furness LA17 7UP

| Today | See what it's worth now |
| 27 May 2025 | £250,000 |
No other historical records.
9, Burlington Close, Kirkby-in-furness LA17 7UG

| Today | See what it's worth now |
| 23 Apr 2025 | £215,000 |
| 20 Oct 2022 | £190,000 |
Burlington House West, Kirkby In Furness, Kirkby-in-furness LA17 7UW
| Today | See what it's worth now |
| 23 Apr 2025 | £335,000 |
No other historical records.
Quinta Cottage, Sandside, Kirkby-in-furness LA17 7UA

| Today | See what it's worth now |
| 28 Mar 2025 | £155,000 |
| 26 Nov 2020 | £115,000 |
2, Jubilee Drive, Kirkby-in-furness LA17 7AD
| Today | See what it's worth now |
| 7 Mar 2025 | £425,000 |
No other historical records.
66, Burlington Close, Kirkby-in-furness LA17 7UG
| Today | See what it's worth now |
| 28 Feb 2025 | £156,000 |
No other historical records.
Fell Side, School Road, Kirkby-in-furness LA17 7UF

| Today | See what it's worth now |
| 21 Feb 2025 | £220,000 |
No other historical records.
14, Jubilee Drive, Kirkby-in-furness LA17 7AD
| Today | See what it's worth now |
| 6 Jan 2025 | £225,000 |
No other historical records.
6, Beckside Court, Beckside, Kirkby-in-furness LA17 7TQ

| Today | See what it's worth now |
| 6 Dec 2024 | £280,000 |
| 17 Jul 2015 | £217,500 |

Source Acknowledgement: © Crown copyright. England and Wales house price data is publicly available information produced by the HM Land Registry.This material was last updated on 9 July 2026. It covers the period from 1 January 1995 to 30 April 2026 and contains property transactions which have been registered during that period. Contains HM Land Registry data © Crown copyright and database right 2026. This data is licensed under the Open Government Licence v3.0.
Disclaimer: Rightmove.co.uk provides this HM Land Registry data "as is". The burden for fitness of the data relies completely with the user and is provided for informational purposes only. No warranty, express or implied, is given relating to the accuracy of content of the HM Land Registry data and Rightmove does not accept any liability for error or omission. If you have found an error with the data or need further information please contact HM Land Registry.
Permitted Use: Viewers of this Information are granted permission to access this Crown copyright material and to download it onto electronic, magnetic, optical or similar storage media provided that such activities are for private research, study or in-house use only. Any other use of the material requires the formal written permission of Land Registry which can be requested from us, and is subject to an additional licence and associated charge.
Rightmove takes no liability for your use of, or reliance on, Rightmove's Instant Valuation due to the limitations of our tracking tool listed here. Use of this tool is taken entirely at your own risk. All rights reserved.