
House Prices in Loppergarth
House prices in Loppergarth have an overall average of £269,562 over the last year.
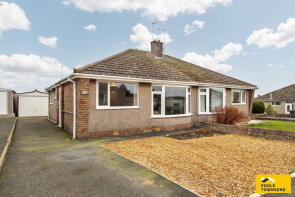
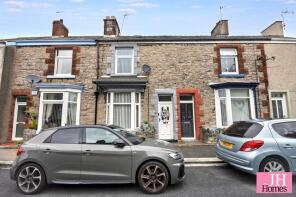
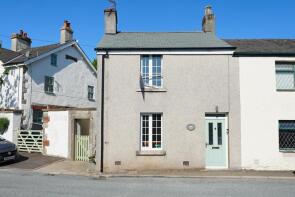
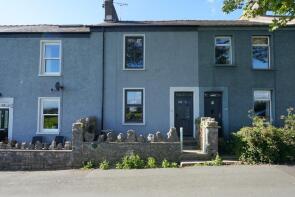
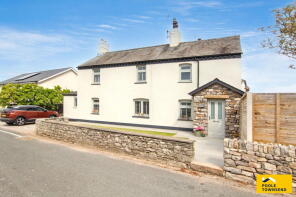
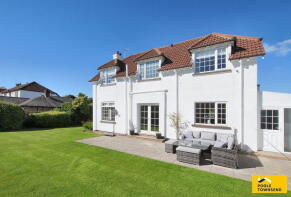
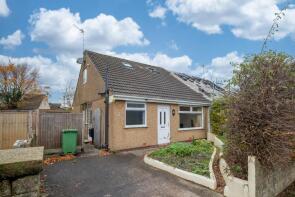
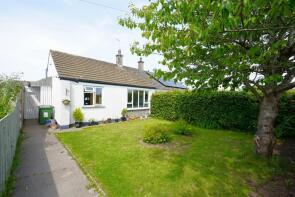
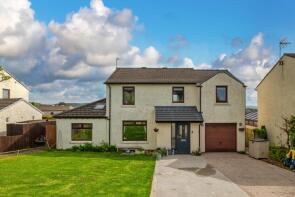
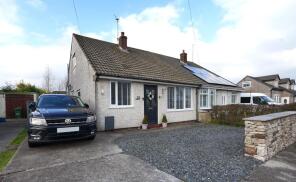
The majority of properties sold in Loppergarth during the last year were terraced properties, selling for an average price of £217,257. Semi-detached properties sold for an average of £261,752, with detached properties fetching £412,969.
Overall, the historical sold prices in Loppergarth over the last year were 8% down on the previous year and 5% down on the 2023 peak of £284,461.
Properties Sold
27, Dorchester Crescent, Ulverston LA12 9LP
| Today | See what it's worth now |
| 14 Apr 2026 | £255,000 |
| 23 Dec 2020 | £200,000 |
5, Argyle Street, Ulverston LA12 0BD
| Today | See what it's worth now |
| 9 Apr 2026 | £195,000 |
| 20 Apr 2018 | £135,000 |
No other historical records.
1, Post Office Row, Gleaston, Ulverston LA12 0QB
| Today | See what it's worth now |
| 2 Apr 2026 | £260,000 |
| 31 Jul 2014 | £270,000 |
No other historical records.
51, Fox Street, Ulverston LA12 0HT
| Today | See what it's worth now |
| 27 Mar 2026 | £255,000 |
| 25 Sep 1998 | £72,000 |
No other historical records.
60, Park Road, Ulverston LA12 0HH
| Today | See what it's worth now |
| 27 Mar 2026 | £200,000 |
| 27 Jun 2017 | £133,000 |
No other historical records.
Walnut House, Scales, Ulverston LA12 0PE
| Today | See what it's worth now |
| 20 Mar 2026 | £415,000 |
| 26 Sep 2017 | £230,000 |
3, Urswick Road, Ulverston LA12 9LG
| Today | See what it's worth now |
| 12 Mar 2026 | £615,000 |
| 16 Dec 2021 | £500,000 |
4, Park Side, Ulverston LA12 0HR
| Today | See what it's worth now |
| 10 Mar 2026 | £250,000 |
| 29 Nov 2021 | £231,000 |
67, Lightburn Avenue, Ulverston LA12 0DL
| Today | See what it's worth now |
| 6 Mar 2026 | £392,500 |
| 30 Nov 2012 | £235,000 |
16, South Green, Ulverston LA12 0UJ
| Today | See what it's worth now |
| 2 Mar 2026 | £400,000 |
| 4 Oct 2006 | £250,000 |
54, Hartley Street, Ulverston LA12 0AN
| Today | See what it's worth now |
| 27 Feb 2026 | £210,000 |
| 11 Dec 2020 | £180,000 |
Pennington Croft, The Green, Ulverston LA12 0LX
| Today | See what it's worth now |
| 23 Feb 2026 | £465,000 |
| 30 Jun 2021 | £450,000 |
No other historical records.
Hill Crest, Gleaston, Ulverston LA12 0QA
| Today | See what it's worth now |
| 20 Feb 2026 | £315,000 |
| 31 Mar 2023 | £315,000 |
No other historical records.
3, High Stable Cottages, Lindal, Ulverston LA12 0LE
| Today | See what it's worth now |
| 20 Feb 2026 | £239,000 |
| 3 Feb 2023 | £229,000 |
12, Springfield Park Road, Ulverston LA12 0EQ
| Today | See what it's worth now |
| 20 Feb 2026 | £400,000 |
No other historical records.
2, Cox Street, Ulverston LA12 0AS
| Today | See what it's worth now |
| 30 Jan 2026 | £138,000 |
| 15 Jul 2016 | £132,000 |
8, Chapel Street, Ulverston LA12 0BA
| Today | See what it's worth now |
| 30 Jan 2026 | £215,000 |
| 8 Dec 2016 | £167,000 |
88, Park Road, Ulverston LA12 0HJ
| Today | See what it's worth now |
| 23 Jan 2026 | £198,000 |
| 21 Nov 2024 | £177,500 |
2, Back Fox Street, Ulverston LA12 0JH
| Today | See what it's worth now |
| 23 Jan 2026 | £310,000 |
| 25 Jun 2021 | £140,000 |
No other historical records.
14, Lightburn Road, Ulverston LA12 0AU

| Today | See what it's worth now |
| 16 Jan 2026 | £250,000 |
| 11 Jan 2019 | £215,000 |
15, Bracken Grove, Ulverston LA12 0XG
| Today | See what it's worth now |
| 15 Jan 2026 | £372,000 |
| 18 Jul 2019 | £290,000 |
22, Park Field, Ulverston LA12 0HW
| Today | See what it's worth now |
| 15 Jan 2026 | £260,000 |
| 10 Feb 2022 | £228,000 |
5, Anchor Gardens, Ulverston LA12 0AP
| Today | See what it's worth now |
| 9 Jan 2026 | £282,000 |
| 7 Oct 2022 | £258,000 |
No other historical records.
Source Acknowledgement: © Crown copyright. England and Wales house price data is publicly available information produced by the HM Land Registry.This material was last updated on 9 July 2026. It covers the period from 1 January 1995 to 30 April 2026 and contains property transactions which have been registered during that period. Contains HM Land Registry data © Crown copyright and database right 2026. This data is licensed under the Open Government Licence v3.0.
Disclaimer: Rightmove.co.uk provides this HM Land Registry data "as is". The burden for fitness of the data relies completely with the user and is provided for informational purposes only. No warranty, express or implied, is given relating to the accuracy of content of the HM Land Registry data and Rightmove does not accept any liability for error or omission. If you have found an error with the data or need further information please contact HM Land Registry.
Permitted Use: Viewers of this Information are granted permission to access this Crown copyright material and to download it onto electronic, magnetic, optical or similar storage media provided that such activities are for private research, study or in-house use only. Any other use of the material requires the formal written permission of Land Registry which can be requested from us, and is subject to an additional licence and associated charge.
Rightmove takes no liability for your use of, or reliance on, Rightmove's Instant Valuation due to the limitations of our tracking tool listed here. Use of this tool is taken entirely at your own risk. All rights reserved.