
House Prices in Hollingdean
House prices in Hollingdean have an overall average of £475,276 over the last year.
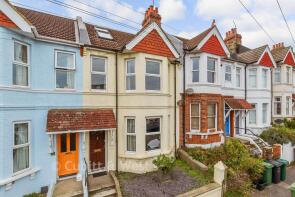
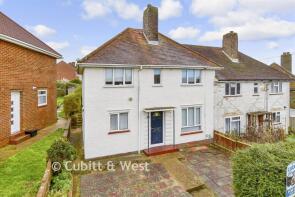
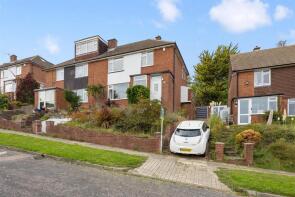
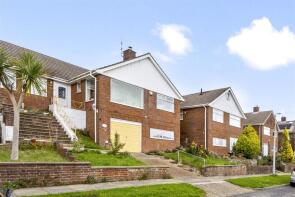
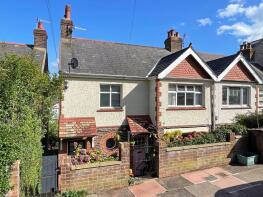
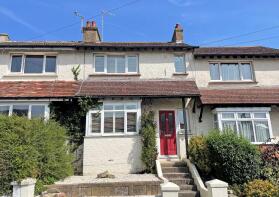
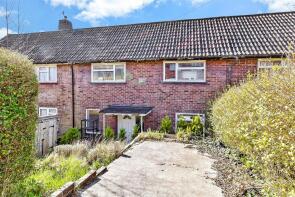
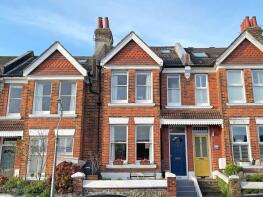
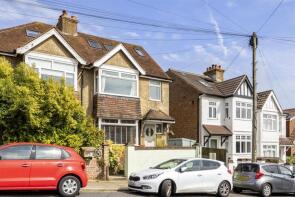
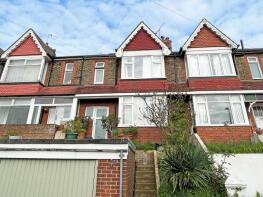
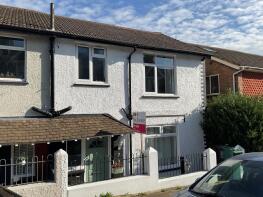
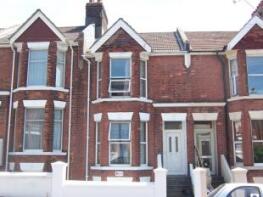
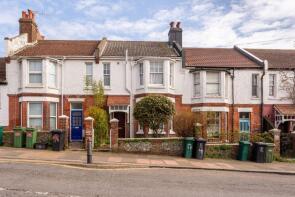
The majority of properties sold in Hollingdean during the last year were terraced properties, selling for an average price of £483,007. Semi-detached properties sold for an average of £535,454, with flats fetching £297,408.
Overall, the historical sold prices in Hollingdean over the last year were 3% up on the previous year and 2% down on the 2022 peak of £485,128.
Properties Sold
181, Hollingdean Terrace, Brighton BN1 7HF
| Today | See what it's worth now |
| 1 Apr 2026 | £620,000 |
| 29 Mar 2021 | £370,000 |
No other historical records.
4, Brentwood Close, Brighton BN1 7EW

| Today | See what it's worth now |
| 16 Mar 2026 | £428,500 |
No other historical records.
63, Hollingbury Road, Brighton BN1 7JB
| Today | See what it's worth now |
| 13 Mar 2026 | £500,000 |
| 9 Jul 1999 | £84,950 |
No other historical records.
62, Stephens Road, Brighton BN1 7ER
| Today | See what it's worth now |
| 11 Mar 2026 | £370,000 |
| 17 Nov 2015 | £275,000 |
71, Uplands Road, Brighton BN1 7FA
| Today | See what it's worth now |
| 12 Feb 2026 | £470,000 |
| 27 Oct 2023 | £490,000 |
29, Wolverstone Drive, Brighton BN1 7FB
| Today | See what it's worth now |
| 30 Jan 2026 | £430,000 |
| 7 Jan 2004 | £192,000 |
No other historical records.
62, Stanmer Park Road, Brighton BN1 7JJ
| Today | See what it's worth now |
| 23 Jan 2026 | £388,000 |
| 14 May 2012 | £225,000 |
9, Stanmer Park Road, Brighton BN1 7JL
| Today | See what it's worth now |
| 17 Dec 2025 | £440,000 |
| 4 Dec 1998 | £87,000 |
8, Stephens Road, Brighton BN1 7ER
| Today | See what it's worth now |
| 17 Dec 2025 | £385,000 |
| 12 Jul 2001 | £110,000 |
No other historical records.
8, Hertford Road, Brighton BN1 7GF
| Today | See what it's worth now |
| 15 Dec 2025 | £480,000 |
No other historical records.
100, Roedale Road, Brighton BN1 7GD
| Today | See what it's worth now |
| 12 Dec 2025 | £420,000 |
| 14 Sep 2007 | £225,250 |
No other historical records.
36, Hollingbury Rise, Brighton BN1 7HJ

| Today | See what it's worth now |
| 11 Dec 2025 | £645,000 |
No other historical records.
3, Dunster Close, Brighton BN1 7ED
| Today | See what it's worth now |
| 24 Nov 2025 | £330,000 |
| 12 Jun 2013 | £195,000 |
No other historical records.
42, Stanmer Villas, Brighton BN1 7HP
| Today | See what it's worth now |
| 21 Nov 2025 | £512,500 |
| 1 Dec 2006 | £269,950 |
Ground Floor Flat, 140, Hollingdean Terrace, Brighton BN1 7HE
| Today | See what it's worth now |
| 17 Nov 2025 | £302,000 |
| 23 Jan 2020 | £280,000 |
29, Stanmer Park Road, Brighton BN1 7JL
| Today | See what it's worth now |
| 14 Nov 2025 | £608,000 |
| 1 Sep 2017 | £492,500 |
66, Davey Drive, Brighton BN1 7BJ

| Today | See what it's worth now |
| 10 Nov 2025 | £452,500 |
| 19 May 2022 | £290,000 |
No other historical records.
128, Hollingdean Terrace, Brighton BN1 7HE
| Today | See what it's worth now |
| 10 Nov 2025 | £645,050 |
| 30 Sep 2011 | £245,000 |
38, Dudley Road, Brighton BN1 7GN
| Today | See what it's worth now |
| 6 Nov 2025 | £565,000 |
No other historical records.
2, Stanmer Park Road, Brighton BN1 7JJ
| Today | See what it's worth now |
| 30 Oct 2025 | £550,000 |
| 30 Sep 2008 | £200,000 |
No other historical records.
12a, Hollingbury Road, Brighton BN1 7JA
| Today | See what it's worth now |
| 23 Oct 2025 | £200,000 |
| 25 Jul 2014 | £223,000 |
46, Hollingbury Road, Brighton BN1 7JA
| Today | See what it's worth now |
| 20 Oct 2025 | £572,000 |
| 29 Apr 2004 | £232,000 |
24, Stanmer Park Road, Brighton BN1 7JJ
| Today | See what it's worth now |
| 20 Oct 2025 | £425,000 |
| 18 Feb 2022 | £415,000 |
No other historical records.
Source Acknowledgement: © Crown copyright. England and Wales house price data is publicly available information produced by the HM Land Registry.This material was last updated on 9 July 2026. It covers the period from 1 January 1995 to 30 April 2026 and contains property transactions which have been registered during that period. Contains HM Land Registry data © Crown copyright and database right 2026. This data is licensed under the Open Government Licence v3.0.
Disclaimer: Rightmove.co.uk provides this HM Land Registry data "as is". The burden for fitness of the data relies completely with the user and is provided for informational purposes only. No warranty, express or implied, is given relating to the accuracy of content of the HM Land Registry data and Rightmove does not accept any liability for error or omission. If you have found an error with the data or need further information please contact HM Land Registry.
Permitted Use: Viewers of this Information are granted permission to access this Crown copyright material and to download it onto electronic, magnetic, optical or similar storage media provided that such activities are for private research, study or in-house use only. Any other use of the material requires the formal written permission of Land Registry which can be requested from us, and is subject to an additional licence and associated charge.
Rightmove takes no liability for your use of, or reliance on, Rightmove's Instant Valuation due to the limitations of our tracking tool listed here. Use of this tool is taken entirely at your own risk. All rights reserved.