
House Prices in Hunger Hill
House prices in Hunger Hill have an overall average of £265,667 over the last year.
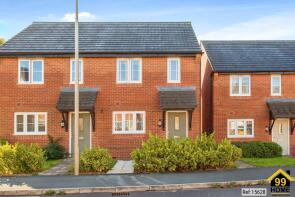
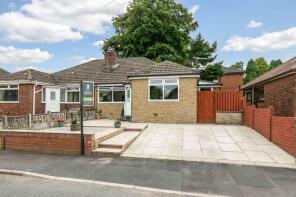
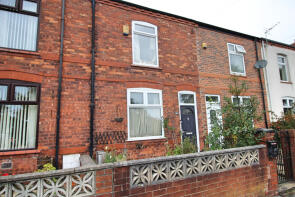
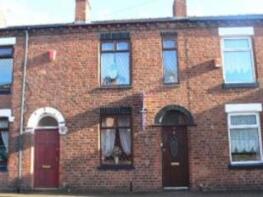
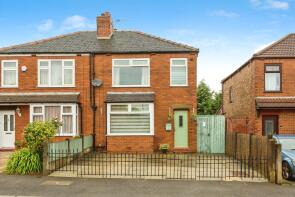
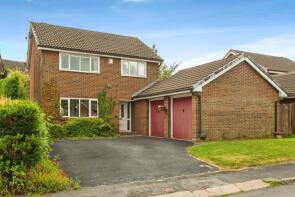
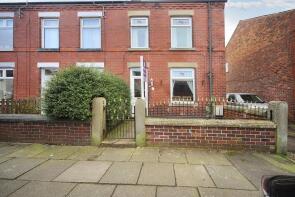
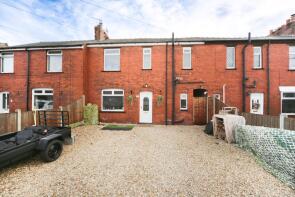
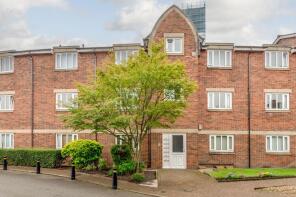
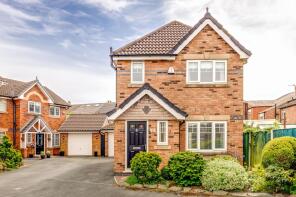
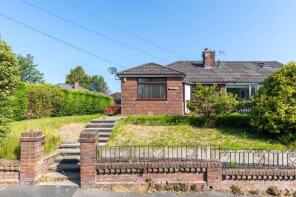
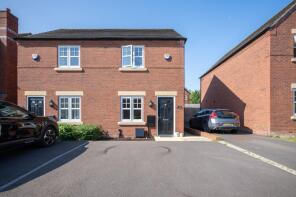
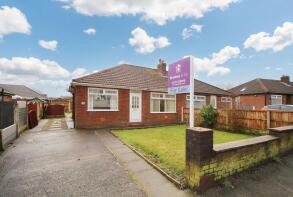
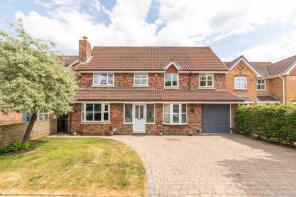
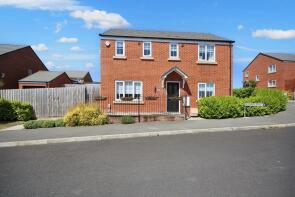
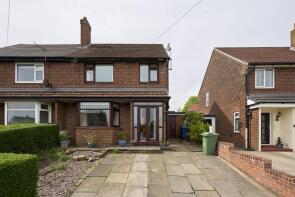
The majority of properties sold in Hunger Hill during the last year were detached properties, selling for an average price of £383,463. Semi-detached properties sold for an average of £217,167, with terraced properties fetching £153,630.
Overall, the historical sold prices in Hunger Hill over the last year were 3% down on the previous year and similar to the 2023 peak of £264,538.
Properties Sold
18, Buttercup Meadow, Standish WN6 0ZU
| Today | See what it's worth now |
| 20 Feb 2026 | £52,500 |
No other historical records.
35, Bentham Road, Wigan WN6 0ND
| Today | See what it's worth now |
| 16 Feb 2026 | £170,000 |
| 18 Dec 2015 | £135,000 |
85, Heaton Street, Wigan WN6 0DA
| Today | See what it's worth now |
| 16 Feb 2026 | £150,000 |
| 27 Sep 2013 | £99,950 |
15, Church Street, Standish WN6 0JT
| Today | See what it's worth now |
| 11 Feb 2026 | £164,000 |
No other historical records.
1, The Limes, Wigan WN6 0BJ
| Today | See what it's worth now |
| 9 Feb 2026 | £670,000 |
No other historical records.
7, Kenyon Road, Wigan WN6 0NX
| Today | See what it's worth now |
| 30 Jan 2026 | £287,500 |
| 25 Feb 2021 | £250,000 |
No other historical records.
16, Greenland Avenue, Wigan WN6 0TH
| Today | See what it's worth now |
| 30 Jan 2026 | £240,850 |
| 9 Jan 2009 | £125,000 |
21, Boars Head Avenue, Wigan WN6 0BH
| Today | See what it's worth now |
| 30 Jan 2026 | £345,000 |
| 12 Dec 2019 | £250,000 |
No other historical records.
27, Collingwood Street, Wigan WN6 0JL
| Today | See what it's worth now |
| 28 Jan 2026 | £155,000 |
| 17 Jan 2022 | £140,000 |
6, Brookfield Road, Wigan WN6 0PJ
| Today | See what it's worth now |
| 21 Jan 2026 | £190,000 |
| 12 Jun 2020 | £160,000 |
16, Bramley Court, Bradley Lane, Wigan WN6 0JZ
| Today | See what it's worth now |
| 16 Jan 2026 | £165,000 |
| 12 Jul 2011 | £125,000 |
2, Hayward Grove, Wigan WN6 0PG
| Today | See what it's worth now |
| 13 Jan 2026 | £232,000 |
| 3 Jun 2003 | £119,950 |
No other historical records.
65, Bentham Road, Standish WN6 0ND
| Today | See what it's worth now |
| 9 Jan 2026 | £205,000 |
No other historical records.
34, Iron Drive, Standish WN6 0UZ
| Today | See what it's worth now |
| 19 Dec 2025 | £224,000 |
| 31 Jul 2020 | £170,750 |
No other historical records.
1, Eagle Close, Wigan WN6 0WE
| Today | See what it's worth now |
| 19 Dec 2025 | £297,000 |
| 31 Jul 2020 | £239,750 |
No other historical records.
56, Coniston Park Drive, Wigan WN6 0AS
| Today | See what it's worth now |
| 19 Dec 2025 | £188,000 |
| 14 Dec 2005 | £135,000 |
6, Spearwort Close, Wigan WN6 0ZW
| Today | See what it's worth now |
| 19 Dec 2025 | £238,000 |
| 9 Feb 2021 | £218,500 |
No other historical records.
13, Chisholm Close, Standish WN6 0QP
| Today | See what it's worth now |
| 18 Dec 2025 | £237,000 |
No other historical records.
88, Wigan Road, Standish WN6 0BA
| Today | See what it's worth now |
| 17 Dec 2025 | £210,000 |
No other historical records.
185, Bradley Lane, Wigan WN6 0NA
| Today | See what it's worth now |
| 16 Dec 2025 | £155,000 |
| 26 Feb 2015 | £117,000 |
No other historical records.
26, Churchlands Lane, Wigan WN6 0XU
| Today | See what it's worth now |
| 12 Dec 2025 | £425,000 |
| 26 Oct 2020 | £341,000 |
2, Sedgewick Green, Wigan WN6 0YT
| Today | See what it's worth now |
| 12 Dec 2025 | £295,000 |
| 30 Jun 2020 | £229,995 |
No other historical records.
12, Ashfield Park Drive, Standish WN6 0EE
| Today | See what it's worth now |
| 12 Dec 2025 | £225,000 |
| 4 Sep 2024 | £218,000 |
No other historical records.
Source Acknowledgement: © Crown copyright. England and Wales house price data is publicly available information produced by the HM Land Registry.This material was last updated on 15 May 2026. It covers the period from 1 January 1995 to 31 March 2026 and contains property transactions which have been registered during that period. Contains HM Land Registry data © Crown copyright and database right 2026. This data is licensed under the Open Government Licence v3.0.
Disclaimer: Rightmove.co.uk provides this HM Land Registry data "as is". The burden for fitness of the data relies completely with the user and is provided for informational purposes only. No warranty, express or implied, is given relating to the accuracy of content of the HM Land Registry data and Rightmove does not accept any liability for error or omission. If you have found an error with the data or need further information please contact HM Land Registry.
Permitted Use: Viewers of this Information are granted permission to access this Crown copyright material and to download it onto electronic, magnetic, optical or similar storage media provided that such activities are for private research, study or in-house use only. Any other use of the material requires the formal written permission of Land Registry which can be requested from us, and is subject to an additional licence and associated charge.
Map data ©OpenStreetMap contributors.
Rightmove takes no liability for your use of, or reliance on, Rightmove's Instant Valuation due to the limitations of our tracking tool listed here. Use of this tool is taken entirely at your own risk. All rights reserved.