
House Prices in Ings Road Estate
House prices in Ings Road Estate have an overall average of £173,997 over the last year.
The majority of properties sold in Ings Road Estate during the last year were semi-detached properties, selling for an average price of £190,907. Terraced properties sold for an average of £138,375, with detached properties fetching £210,000.
Overall, the historical sold prices in Ings Road Estate over the last year were 7% down on the previous year and 3% up on the 2023 peak of £168,921.
Properties Sold
25, Skirbeck Road, Hull HU8 0HR
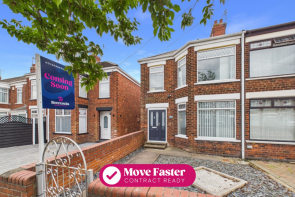
| Today | See today's value |
| 21 Aug 2026 | £175,000 |
| 31 Aug 2018 | £106,500 |
No other historical records.
57, Ings Road, Hull HU8 0SB

| Today | See today's value |
| 17 Aug 2026 | £310,000 |
| 31 Jan 2020 | £275,000 |
5, Clarence Avenue, Ings Road, Hull HU8 0LT
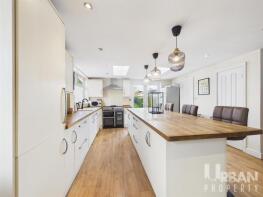
| Today | See today's value |
| 17 Aug 2026 | £203,000 |
| 24 May 2013 | £109,000 |
No other historical records.
51, Whitethorn Way, Hull HU8 0JF
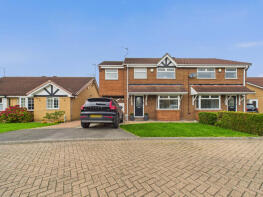
| Today | See today's value |
| 14 Aug 2026 | £235,000 |
| 23 Apr 2014 | £162,000 |
No other historical records.
332, Hathersage Road, Hull HU8 0EY
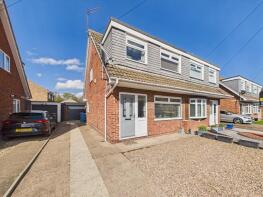
| Today | See today's value |
| 30 Jul 2026 | £190,000 |
| 27 Jun 2014 | £116,000 |
2, Pinderfield Close, Hull HU8 0FE
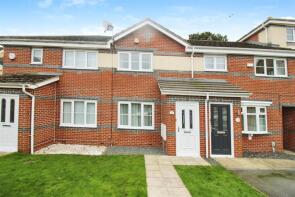
| Today | See today's value |
| 29 Jul 2026 | £150,000 |
| 2 Apr 2004 | £84,950 |
38, Moffat Close, Hull HU8 0AU
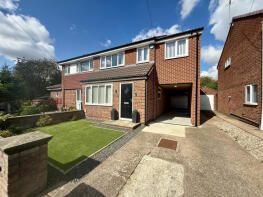
| Today | See today's value |
| 20 Jul 2026 | £220,000 |
| 7 Jul 2014 | £124,000 |
24, Clapham Avenue, Hull HU8 0QQ

| Today | See today's value |
| 10 Jul 2026 | £140,000 |
| 28 Oct 2022 | £100,000 |
3, Balham Avenue, Hull HU8 0PE

| Today | See today's value |
| 10 Jul 2026 | £110,000 |
| 31 Oct 2017 | £75,500 |
358, Ings Road, Hull HU8 0NA

| Today | See today's value |
| 10 Jul 2026 | £265,000 |
| 13 Jul 2001 | £44,000 |
No other historical records.
35, Ings Road, Hull HU8 0SB
| Today | See today's value |
| 3 Jul 2026 | £365,000 |
| 30 Jul 2003 | £114,950 |
161, Lambwath Road, Hull HU8 0HL
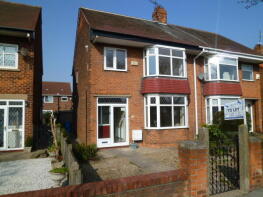
| Today | See today's value |
| 2 Jul 2026 | £70,000 |
| 10 Jan 2012 | £85,000 |
No other historical records.
64, Brixton Close, Hull HU8 0QJ

| Today | See today's value |
| 1 Jul 2026 | £126,000 |
| 5 Feb 2018 | £100,000 |
53, Mead Street, Hull HU8 0NG
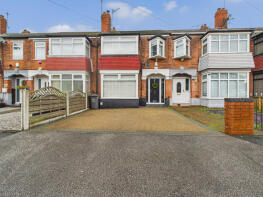
| Today | See today's value |
| 1 Jul 2026 | £205,000 |
| 1 Feb 2023 | £190,000 |
41, Lancaster Drive, Hull HU8 0HJ
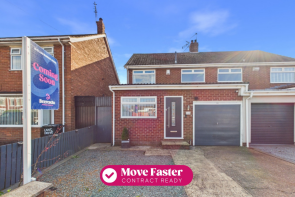
| Today | See today's value |
| 1 Jul 2026 | £215,000 |
| 5 Jan 1996 | £47,000 |
No other historical records.
71, Middlesex Road, Hull HU8 0AF
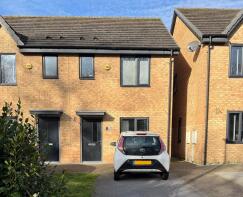
| Today | See today's value |
| 26 Jun 2026 | £165,000 |
| 30 Jun 2021 | £139,500 |
970, Sutton Road, Hull HU8 0HT

| Today | See today's value |
| 3 Jun 2026 | £98,289 |
| 16 Apr 2021 | £155,000 |
56, Clapham Avenue, Hull HU8 0QG

| Today | See today's value |
| 2 Jun 2026 | £115,000 |
| 31 Oct 2016 | £82,500 |
No other historical records.
22, Munroe Close, Hull HU8 0AX
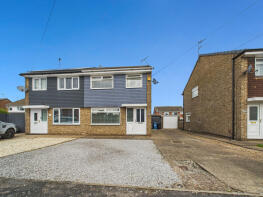
| Today | See today's value |
| 1 Jun 2026 | £180,000 |
| 7 Dec 2018 | £138,500 |
60, Brixton Close, Kingston Upon Hull HU8 0QJ

| Today | See today's value |
| 29 May 2026 | £100,000 |
| 7 Mar 2008 | £52,000 |
24, Guildford Avenue, Hull HU8 0LB
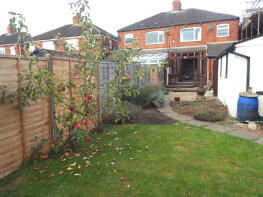
| Today | See today's value |
| 1 May 2026 | £167,000 |
| 7 Jul 2017 | £132,500 |
11, Cullen Close, Hull HU8 0AL
| Today | See today's value |
| 30 Apr 2026 | £178,000 |
| 28 Apr 2017 | £111,500 |
No other historical records.
990, Sutton Road, Hull HU8 0HT
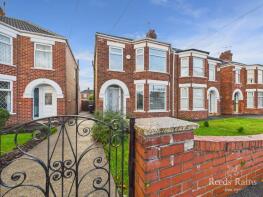
| Today | See today's value |
| 29 Apr 2026 | £218,000 |
| 27 Jun 2003 | £89,500 |
No other historical records.


Rightmove takes no liability for your use of, or reliance on, Rightmove's Instant Valuation due to the limitations of our tracking tool listed here. Use of this tool is taken entirely at your own risk. All rights reserved.