
House Prices in Kenton Bank Foot
House prices in Kenton Bank Foot have an overall average of £258,304 over the last year.
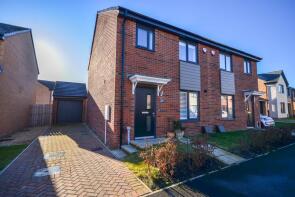
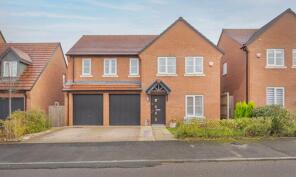
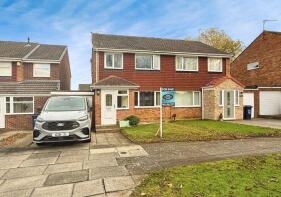
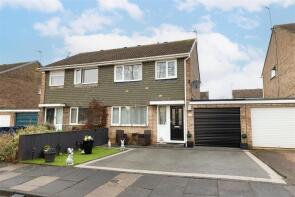
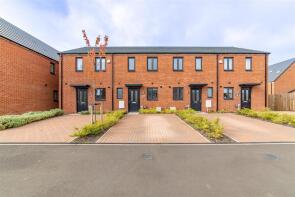
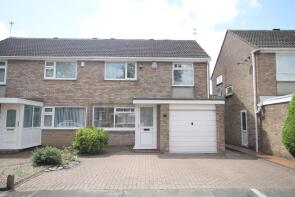
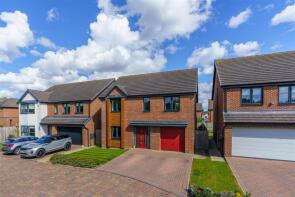
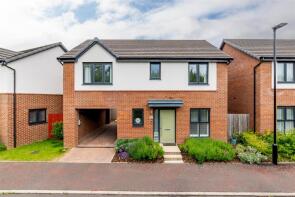
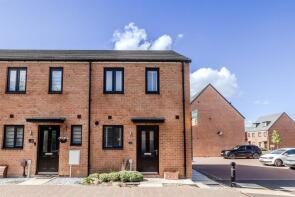
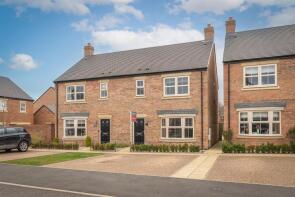
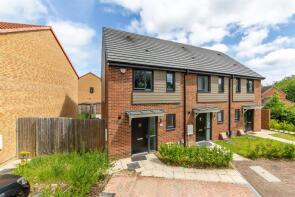
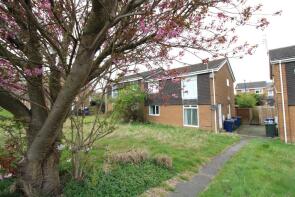
The majority of properties sold in Kenton Bank Foot during the last year were semi-detached properties, selling for an average price of £229,607. Detached properties sold for an average of £400,339, with terraced properties fetching £196,944.
Overall, the historical sold prices in Kenton Bank Foot over the last year were 2% down on the previous year and 7% down on the 2022 peak of £276,467.
Properties Sold
54, Eden Park Court, Newcastle Upon Tyne NE13 8BA
| Today | See what it's worth now |
| 24 Apr 2026 | £265,000 |
| 18 Mar 2021 | £219,995 |
No other historical records.
51, Broadfield Meadows, Kenton Bank Foot, Newcastle Upon Tyne NE13 8BB

| Today | See what it's worth now |
| 10 Apr 2026 | £462,500 |
| 18 Dec 2020 | £338,995 |
No other historical records.
15, Ilminster Court, Newcastle Upon Tyne NE3 2QY
| Today | See what it's worth now |
| 1 Apr 2026 | £52,500 |
| 28 Apr 2000 | £50,950 |
5, Broadfield Meadows, Kenton Bank Foot, Newcastle Upon Tyne NE13 8BB
| Today | See what it's worth now |
| 30 Mar 2026 | £499,950 |
| 12 Dec 2019 | £379,995 |
No other historical records.
21, Cowdray Court, Newcastle Upon Tyne NE3 2TZ
| Today | See what it's worth now |
| 26 Mar 2026 | £210,000 |
| 1 Aug 2017 | £165,000 |
91, Broadfield Meadows, Kenton Bank Foot, Newcastle Upon Tyne NE13 8BB
| Today | See what it's worth now |
| 20 Mar 2026 | £145,460 |
| 7 May 2021 | £367,995 |
No other historical records.
6, Fetcham Court, Newcastle Upon Tyne NE3 2UL
| Today | See what it's worth now |
| 13 Mar 2026 | £250,000 |
| 16 Jul 2007 | £124,000 |
No other historical records.
6, Knowsley Court, Newcastle Upon Tyne NE3 2FJ

| Today | See what it's worth now |
| 13 Feb 2026 | £125,000 |
| 2 Sep 2010 | £110,000 |
No other historical records.
6, Hawk Chase, Kenton Bank Foot, Newcastle Upon Tyne NE13 8DB
| Today | See what it's worth now |
| 6 Feb 2026 | £217,000 |
| 30 Jun 2023 | £189,995 |
No other historical records.
6, Ascot Court, Newcastle Upon Tyne NE3 2UH
| Today | See what it's worth now |
| 27 Jan 2026 | £210,000 |
| 4 Jul 2002 | £90,000 |
No other historical records.
49, Foxfield Close, Kenton Bankfoot, Newcastle Upon Tyne NE13 8AY
| Today | See what it's worth now |
| 6 Jan 2026 | £450,000 |
| 22 Feb 2019 | £394,950 |
No other historical records.
36, Eden Park Court, Newcastle Upon Tyne NE13 8BA
| Today | See what it's worth now |
| 6 Jan 2026 | £235,000 |
| 24 Jul 2020 | £217,995 |
No other historical records.
39, Foxfield Close, Kenton Bankfoot, Newcastle Upon Tyne NE13 8AY
| Today | See what it's worth now |
| 18 Dec 2025 | £397,000 |
| 21 Dec 2018 | £314,950 |
No other historical records.
32, Red Kite Drive, Kenton Bank Foot, Newcastle Upon Tyne NE13 8DA
| Today | See what it's worth now |
| 18 Dec 2025 | £222,500 |
| 20 May 2022 | £177,995 |
No other historical records.
4, Dorchester Place, Kenton Bankfoot, Newcastle Upon Tyne NE13 8BE
| Today | See what it's worth now |
| 5 Dec 2025 | £289,000 |
| 2 Oct 2020 | £249,950 |
No other historical records.
37, Eden Park Court, Newcastle Upon Tyne NE13 8AZ
| Today | See what it's worth now |
| 5 Dec 2025 | £147,000 |
| 22 Dec 2021 | £121,097 |
No other historical records.
1, Eden Park Court, Newcastle Upon Tyne NE13 8AZ
| Today | See what it's worth now |
| 2 Dec 2025 | £395,000 |
| 1 Apr 2022 | £378,995 |
No other historical records.
39, Tudor Walk, Newcastle Upon Tyne NE3 2QT
| Today | See what it's worth now |
| 28 Nov 2025 | £106,250 |
| 31 May 2006 | £85,000 |
18, Urswick Court, Newcastle Upon Tyne NE3 2FN
| Today | See what it's worth now |
| 28 Nov 2025 | £235,000 |
| 29 Jan 2004 | £155,000 |
2, Red Kite Drive, Kenton Bank Foot, Newcastle Upon Tyne NE13 8DA
| Today | See what it's worth now |
| 27 Nov 2025 | £290,000 |
| 10 Dec 2021 | £235,995 |
No other historical records.
52, Warbeck Close, Newcastle Upon Tyne NE3 2FG
| Today | See what it's worth now |
| 24 Nov 2025 | £220,000 |
No other historical records.
16, Hawk Chase, Kenton Bank Foot, Newcastle Upon Tyne NE13 8DB
| Today | See what it's worth now |
| 21 Nov 2025 | £210,000 |
| 11 Aug 2023 | £201,995 |
No other historical records.
2, Knowsley Court, Newcastle Upon Tyne NE3 2FJ
| Today | See what it's worth now |
| 21 Nov 2025 | £235,000 |
| 16 Feb 2011 | £149,000 |
Source Acknowledgement: © Crown copyright. England and Wales house price data is publicly available information produced by the HM Land Registry.This material was last updated on 9 July 2026. It covers the period from 1 January 1995 to 30 April 2026 and contains property transactions which have been registered during that period. Contains HM Land Registry data © Crown copyright and database right 2026. This data is licensed under the Open Government Licence v3.0.
Disclaimer: Rightmove.co.uk provides this HM Land Registry data "as is". The burden for fitness of the data relies completely with the user and is provided for informational purposes only. No warranty, express or implied, is given relating to the accuracy of content of the HM Land Registry data and Rightmove does not accept any liability for error or omission. If you have found an error with the data or need further information please contact HM Land Registry.
Permitted Use: Viewers of this Information are granted permission to access this Crown copyright material and to download it onto electronic, magnetic, optical or similar storage media provided that such activities are for private research, study or in-house use only. Any other use of the material requires the formal written permission of Land Registry which can be requested from us, and is subject to an additional licence and associated charge.
Rightmove takes no liability for your use of, or reliance on, Rightmove's Instant Valuation due to the limitations of our tracking tool listed here. Use of this tool is taken entirely at your own risk. All rights reserved.