
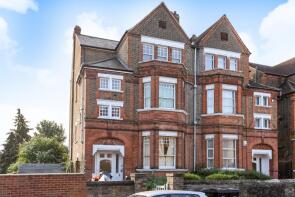
House Prices in Kilburn
House prices in Kilburn have an overall average of £711,752 over the last year.
The majority of properties sold in Kilburn during the last year were flats, selling for an average price of £535,141. Terraced properties sold for an average of £1,300,143, with detached properties fetching £2,986,000.
Overall, the historical sold prices in Kilburn over the last year were 1% down on the previous year and 4% down on the 2022 peak of £743,517.
Properties Sold
97d, Brondesbury Villas, London NW6 6AG
| Today | See what it's worth now |
| 24 Apr 2026 | £545,000 |
| 6 Oct 2022 | £510,000 |
No other historical records.
Flat A, 39, Kingsgate Road, London NW6 4TD
| Today | See what it's worth now |
| 15 Apr 2026 | £300,000 |
| 19 Oct 2017 | £515,000 |
Ground Floor Flat, 54, Glengall Road, London NW6 7ER

| Today | See what it's worth now |
| 10 Apr 2026 | £780,000 |
| 13 May 2022 | £705,000 |
Flat A, 34, Richborough Road, London NW2 3LX
| Today | See what it's worth now |
| 9 Apr 2026 | £430,000 |
No other historical records.
28, Streatley Road, London NW6 7LS

| Today | See what it's worth now |
| 9 Apr 2026 | £1,499,950 |
No other historical records.
21, Burton Road, London NW6 7LL

| Today | See what it's worth now |
| 2 Apr 2026 | £1,775,000 |
| 9 Nov 1999 | £430,000 |
Flat 29, Kendal Court, Shoot-up Hill, London NW2 3PD
| Today | See what it's worth now |
| 2 Apr 2026 | £410,000 |
| 12 Jun 2015 | £390,000 |
No other historical records.
74, Tarranbrae, Willesden Lane, Kilburn, London NW6 7PW

| Today | See what it's worth now |
| 1 Apr 2026 | £485,000 |
| 30 May 2017 | £532,000 |
Flat 1, 27, Maygrove Road, London NW6 2EE

| Today | See what it's worth now |
| 1 Apr 2026 | £392,000 |
| 28 Mar 2024 | £377,500 |
Flat 90, Hillsborough Court, Mortimer Crescent, London NW6 5NT
| Today | See what it's worth now |
| 1 Apr 2026 | £338,000 |
| 16 Dec 2016 | £384,550 |
Flat 9, Hodge House, Granville Road, London NW6 5HF
| Today | See what it's worth now |
| 1 Apr 2026 | £238,499 |
| 29 Nov 2023 | £835,000 |
No other historical records.
Flat 6, Hinchinbrook House, Mortimer Crescent, London NW6 5UP
| Today | See what it's worth now |
| 31 Mar 2026 | £285,000 |
No other historical records.
42, Thanet Lodge, Mapesbury Road, London NW2 4JA
| Today | See what it's worth now |
| 31 Mar 2026 | £600,000 |
| 29 Nov 2013 | £520,000 |
92, Messina Avenue, London NW6 4LE

| Today | See what it's worth now |
| 31 Mar 2026 | £795,000 |
| 18 Dec 2014 | £800,000 |
3, Alma Birk House, Cavendish Road, London NW6 7XR
| Today | See what it's worth now |
| 31 Mar 2026 | £680,000 |
| 31 Aug 2006 | £336,250 |
21, St Cuthbert's Road, London NW2 3QJ
| Today | See what it's worth now |
| 27 Mar 2026 | £415,000 |
No other historical records.
Flat 7, 189 Newhaven Court, Willesden Lane, Kilburn, London NW6 7YN

| Today | See what it's worth now |
| 27 Mar 2026 | £700,000 |
| 4 Dec 2009 | £485,000 |
Flat 9, 42, Kilburn High Road, London NW6 4HJ

| Today | See what it's worth now |
| 27 Mar 2026 | £335,000 |
| 4 Oct 2017 | £368,000 |
No other historical records.
42, Kingsley Road, London NW6 7RJ

| Today | See what it's worth now |
| 27 Mar 2026 | £750,000 |
| 12 Feb 2021 | £715,000 |
37, Glengall Road, London NW6 7EL
| Today | See what it's worth now |
| 27 Mar 2026 | £480,000 |
| 25 Sep 2023 | £435,000 |
4, Quex Mews, London NW6 4PW
| Today | See what it's worth now |
| 26 Mar 2026 | £677,000 |
| 11 Aug 2006 | £425,000 |
Flat 1, 3, Minster Road, London NW2 3SD

| Today | See what it's worth now |
| 26 Mar 2026 | £762,500 |
| 16 Aug 2019 | £750,000 |
46a, Brondesbury Villas, London NW6 6AB

| Today | See what it's worth now |
| 20 Mar 2026 | £1,320,000 |
| 17 Feb 2017 | £980,000 |
No other historical records.

Source Acknowledgement: © Crown copyright. England and Wales house price data is publicly available information produced by the HM Land Registry.This material was last updated on 9 July 2026. It covers the period from 1 January 1995 to 30 April 2026 and contains property transactions which have been registered during that period. Contains HM Land Registry data © Crown copyright and database right 2026. This data is licensed under the Open Government Licence v3.0.
Disclaimer: Rightmove.co.uk provides this HM Land Registry data "as is". The burden for fitness of the data relies completely with the user and is provided for informational purposes only. No warranty, express or implied, is given relating to the accuracy of content of the HM Land Registry data and Rightmove does not accept any liability for error or omission. If you have found an error with the data or need further information please contact HM Land Registry.
Permitted Use: Viewers of this Information are granted permission to access this Crown copyright material and to download it onto electronic, magnetic, optical or similar storage media provided that such activities are for private research, study or in-house use only. Any other use of the material requires the formal written permission of Land Registry which can be requested from us, and is subject to an additional licence and associated charge.
Rightmove takes no liability for your use of, or reliance on, Rightmove's Instant Valuation due to the limitations of our tracking tool listed here. Use of this tool is taken entirely at your own risk. All rights reserved.