House Prices in Taggart Avenue, Liverpool, L16
House prices in Taggart Avenue have an overall average of £300,000 over the last year.
The majority of properties sold in Taggart Avenue during the last year were semi-detached properties, selling for an average price of £305,000. Terraced properties sold for an average of £295,000.
Overall, the historical sold prices in Taggart Avenue over the last year were 11% up on the previous year and 11% up on the 2021 peak of £270,000.
Properties Sold
151, Taggart Avenue, Liverpool L16 9JA

| Today | See today's value |
| 1 Dec 2025 | £305,000 |
| 30 Aug 2019 | £235,000 |
110, Taggart Avenue, Liverpool L16 9JB

| Today | See today's value |
| 26 Nov 2025 | £295,000 |
| 19 Aug 2019 | £225,000 |
119, Taggart Avenue, Liverpool L16 9JA

| Today | See today's value |
| 26 Aug 2025 | £230,500 |
No other historical records.
Extensions and planning permission in L16
See planning approval stats, extension build costs and value added estimates.
114, Taggart Avenue, Liverpool L16 9JB

| Today | See today's value |
| 14 Apr 2025 | £290,000 |
| 22 Oct 2004 | £160,000 |
112, Taggart Avenue, Liverpool L16 9JB
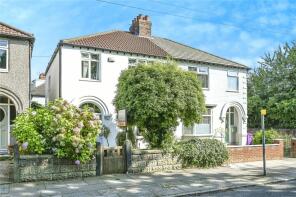
| Today | See today's value |
| 28 Nov 2024 | £290,000 |
| 11 Feb 2005 | £180,000 |
157, Taggart Avenue, Liverpool L16 9JA

| Today | See today's value |
| 3 May 2024 | £236,000 |
| 2 Aug 2002 | £105,000 |
No other historical records.
136, Taggart Avenue, Liverpool L16 9JB
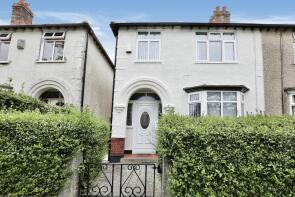
| Today | See today's value |
| 11 Jan 2024 | £315,000 |
| 15 Jan 2021 | £270,000 |
123, Taggart Avenue, Liverpool L16 9JA

| Today | See today's value |
| 10 Aug 2020 | £195,000 |
| 24 Jul 1998 | £60,000 |
No other historical records.
125, Taggart Avenue, Liverpool L16 9JA
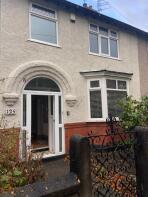
| Today | See today's value |
| 20 Apr 2020 | £240,000 |
| 31 Oct 2013 | £155,000 |
No other historical records.
129, Taggart Avenue, Liverpool L16 9JA

| Today | See today's value |
| 18 Dec 2019 | £256,000 |
| 29 Sep 1995 | £59,999 |
No other historical records.
87, Taggart Avenue, Liverpool L16 9JA
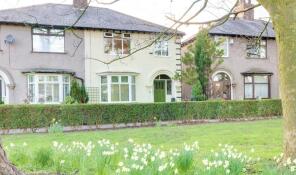
| Today | See today's value |
| 1 Nov 2019 | £235,000 |
| 6 Nov 2015 | £200,000 |
128, Taggart Avenue, Liverpool L16 9JB
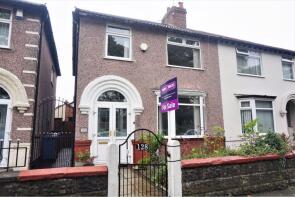
| Today | See today's value |
| 30 Nov 2018 | £237,500 |
| 5 Nov 2010 | £178,000 |
No other historical records.
141, Taggart Avenue, Liverpool L16 9JA

| Today | See today's value |
| 19 Oct 2018 | £245,000 |
| 10 Jul 2008 | £165,000 |
No other historical records.
118, Taggart Avenue, Liverpool L16 9JB
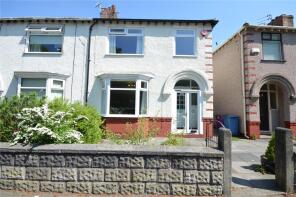
| Today | See today's value |
| 7 Dec 2017 | £222,500 |
| 13 Sep 2013 | £187,500 |
143, Taggart Avenue, Liverpool L16 9JA

| Today | See today's value |
| 9 Jun 2017 | £225,000 |
No other historical records.
127, Taggart Avenue, Liverpool L16 9JA
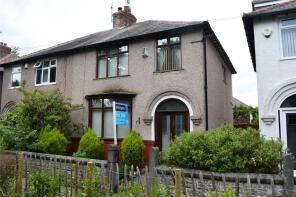
| Today | See today's value |
| 17 Aug 2016 | £182,000 |
No other historical records.
149, Taggart Avenue, Liverpool L16 9JA

| Today | See today's value |
| 28 Nov 2014 | £212,000 |
| 10 Dec 2009 | £171,000 |
131, Taggart Avenue, Liverpool L16 9JA
| Today | See today's value |
| 26 Jul 2013 | £197,000 |
No other historical records.
146, Taggart Avenue, Liverpool L16 9JB

| Today | See today's value |
| 4 Nov 2011 | £181,000 |
| 21 May 2004 | £152,500 |
139, Taggart Avenue, Liverpool L16 9JA
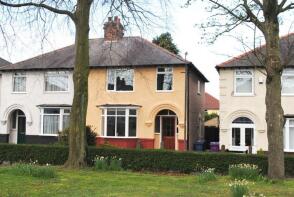
| Today | See today's value |
| 28 Oct 2011 | £185,000 |
No other historical records.
120, Taggart Avenue, Liverpool L16 9JB
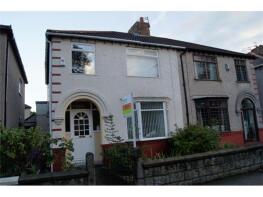
| Today | See today's value |
| 3 Dec 2010 | £180,000 |
| 23 Nov 2005 | £200,000 |
111, Taggart Avenue, Liverpool L16 9JA

| Today | See today's value |
| 29 Oct 2008 | £159,000 |
No other historical records.
109, Taggart Avenue, Liverpool L16 9JA

| Today | See today's value |
| 20 Jun 2008 | £190,000 |
No other historical records.

Rightmove takes no liability for your use of, or reliance on, Rightmove's Instant Valuation due to the limitations of our tracking tool listed here. Use of this tool is taken entirely at your own risk. All rights reserved.