
House Prices in L5
House prices in L5 have an overall average of £129,858 over the last year.
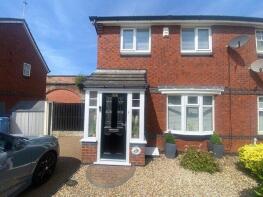
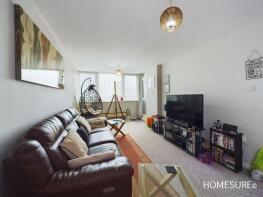
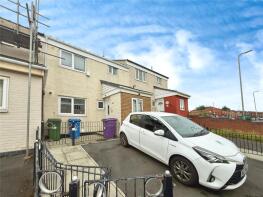
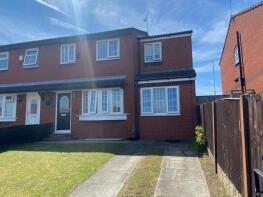
The majority of properties sold in L5 during the last year were terraced properties, selling for an average price of £133,219. Flats sold for an average of £68,716, with semi-detached properties fetching £199,562.
Overall, the historical sold prices in L5 over the last year were similar to the previous year and 4% up on the 2023 peak of £125,387.
Properties Sold
24, Hornby Walk, Liverpool L5 8XH
| Today | See what it's worth now |
| 10 Apr 2026 | £180,000 |
No other historical records.
205, Conway Street, Liverpool L5 3BB
| Today | See what it's worth now |
| 30 Mar 2026 | £15,000 |
| 6 Oct 2004 | £65,950 |
No other historical records.
15, Courtier Close, Liverpool L5 3PT

| Today | See what it's worth now |
| 27 Mar 2026 | £126,000 |
| 16 Oct 2020 | £97,000 |
Extensions and planning permission in L5
See planning approval stats, extension build costs and value added estimates.

6, Houlgrave Road, Liverpool L5 9RQ
| Today | See what it's worth now |
| 6 Mar 2026 | £165,000 |
| 10 Oct 2023 | £147,000 |
42, Barmouth Way, Liverpool L5 9RP
| Today | See what it's worth now |
| 2 Mar 2026 | £145,000 |
| 10 Dec 2001 | £69,995 |
No other historical records.
84, Thirlmere Road, Liverpool L5 6PR
| Today | See what it's worth now |
| 27 Feb 2026 | £125,000 |
| 25 Jul 2003 | £30,000 |
No other historical records.
11, Marnell Close, Liverpool L5 2AR

| Today | See what it's worth now |
| 17 Feb 2026 | £202,000 |
| 27 Jun 2008 | £150,000 |
No other historical records.
68, Kemp Avenue, Liverpool L5 1AF
| Today | See what it's worth now |
| 30 Jan 2026 | £215,000 |
| 24 Aug 2018 | £140,995 |
No other historical records.
9, Northcote Close, Liverpool L5 4TD
| Today | See what it's worth now |
| 20 Jan 2026 | £65,000 |
No other historical records.
83, Conway Street, Liverpool L5 3BA
| Today | See what it's worth now |
| 23 Dec 2025 | £76,500 |
| 4 Aug 2004 | £76,950 |
No other historical records.
Apartment 94, Candia Tower, Jason Street, Liverpool L5 5EN

| Today | See what it's worth now |
| 18 Dec 2025 | £39,706 |
| 12 Jul 2019 | £39,000 |
No other historical records.
51, Harebell Street, Liverpool L5 7RL
| Today | See what it's worth now |
| 12 Dec 2025 | £105,000 |
| 15 Jun 2005 | £41,000 |
No other historical records.
49a, Mark Street, Liverpool L5 0RF

| Today | See what it's worth now |
| 4 Dec 2025 | £54,000 |
| 30 Sep 2016 | £33,000 |
No other historical records.
13, Stockbridge Street, Liverpool L5 6PA
| Today | See what it's worth now |
| 21 Nov 2025 | £95,000 |
| 27 Jul 2018 | £45,000 |
No other historical records.
37, Heyes Street, Liverpool L5 6SE
| Today | See what it's worth now |
| 20 Nov 2025 | £122,500 |
No other historical records.
14, Daisy Street, Liverpool L5 7RW

| Today | See what it's worth now |
| 5 Nov 2025 | £80,000 |
| 22 Nov 2004 | £52,000 |
No other historical records.
24, Wentworth Drive, Liverpool L5 4SY
| Today | See what it's worth now |
| 27 Oct 2025 | £140,000 |
No other historical records.
35, Northumberland Terrace, Liverpool L5 3QE
| Today | See what it's worth now |
| 24 Oct 2025 | £185,000 |
No other historical records.
Room A 182, Phoenix Place, Prince Edwin Street, Liverpool L5 3AA
| Today | See what it's worth now |
| 24 Oct 2025 | £15,000 |
| 28 Apr 2025 | £16,000 |
74, Snowdon Lane, Liverpool L5 9RA
| Today | See what it's worth now |
| 24 Oct 2025 | £197,500 |
| 28 Sep 2001 | £66,495 |
No other historical records.
225, Conway Street, Liverpool L5 3BB
| Today | See what it's worth now |
| 24 Oct 2025 | £62,500 |
| 17 Nov 2004 | £69,950 |
No other historical records.
59, Penrose Street, Liverpool L5 0PS
| Today | See what it's worth now |
| 20 Oct 2025 | £142,000 |
| 3 Dec 2021 | £120,000 |
8, Ermine Crescent, Liverpool L5 0SY
| Today | See what it's worth now |
| 16 Oct 2025 | £240,000 |
| 10 Sep 2010 | £120,500 |
No other historical records.
Source Acknowledgement: © Crown copyright. England and Wales house price data is publicly available information produced by the HM Land Registry.This material was last updated on 9 July 2026. It covers the period from 1 January 1995 to 30 April 2026 and contains property transactions which have been registered during that period. Contains HM Land Registry data © Crown copyright and database right 2026. This data is licensed under the Open Government Licence v3.0.
Disclaimer: Rightmove.co.uk provides this HM Land Registry data "as is". The burden for fitness of the data relies completely with the user and is provided for informational purposes only. No warranty, express or implied, is given relating to the accuracy of content of the HM Land Registry data and Rightmove does not accept any liability for error or omission. If you have found an error with the data or need further information please contact HM Land Registry.
Permitted Use: Viewers of this Information are granted permission to access this Crown copyright material and to download it onto electronic, magnetic, optical or similar storage media provided that such activities are for private research, study or in-house use only. Any other use of the material requires the formal written permission of Land Registry which can be requested from us, and is subject to an additional licence and associated charge.
Rightmove takes no liability for your use of, or reliance on, Rightmove's Instant Valuation due to the limitations of our tracking tool listed here. Use of this tool is taken entirely at your own risk. All rights reserved.