
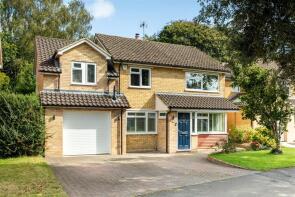
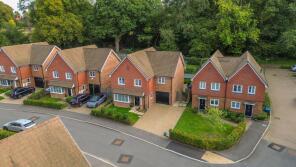
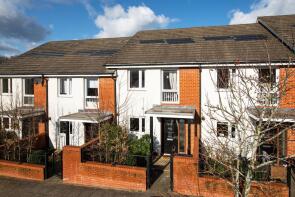
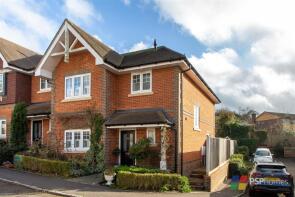
House Prices in Lindfield
House prices in Lindfield have an overall average of £726,750 over the last year.
The majority of properties sold in Lindfield during the last year were detached properties, selling for an average price of £941,824. Semi-detached properties sold for an average of £623,446, with terraced properties fetching £466,036.
Overall, the historical sold prices in Lindfield over the last year were 15% up on the previous year and 16% up on the 2023 peak of £625,856.
Properties Sold
42, Sunte Avenue, Haywards Heath RH16 2AA
| Today | See what it's worth now |
| 16 Apr 2026 | £810,000 |
| 19 Jun 2018 | £636,000 |
35, Plymouth Way, Haywards Heath RH16 3UP
| Today | See what it's worth now |
| 31 Mar 2026 | £400,000 |
| 24 May 2013 | £248,800 |
No other historical records.
15, Oak Bank, Haywards Heath RH16 1RR
| Today | See what it's worth now |
| 27 Mar 2026 | £1,185,000 |
| 12 Aug 2016 | £797,500 |
2, Grahams Cottages, Spring Lane, Haywards Heath RH16 2RF
| Today | See what it's worth now |
| 26 Mar 2026 | £398,500 |
| 16 Dec 2019 | £309,500 |
Flat 12, 28 Littlecote House, Compton Road, Haywards Heath RH16 2JZ
| Today | See what it's worth now |
| 19 Mar 2026 | £244,000 |
| 18 Apr 2018 | £390,000 |
36, Meadow Lane, Haywards Heath RH16 2RJ
| Today | See what it's worth now |
| 17 Mar 2026 | £1,100,000 |
| 27 Nov 2020 | £640,000 |
107, Beech Hill, Haywards Heath RH16 3TS
| Today | See what it's worth now |
| 16 Mar 2026 | £490,000 |
| 9 Aug 2002 | £215,000 |
10, Savill Road, Lindfield RH16 2NX
| Today | See what it's worth now |
| 13 Mar 2026 | £880,000 |
No other historical records.
24, Meadow Lane, Haywards Heath RH16 2RJ
| Today | See what it's worth now |
| 11 Mar 2026 | £540,000 |
| 15 Oct 1999 | £150,000 |
No other historical records.
12, By Sunte, Haywards Heath RH16 2DF
| Today | See what it's worth now |
| 10 Mar 2026 | £890,000 |
| 27 Aug 2009 | £369,950 |
Noahs Ark Cottage, Lewes Road, Haywards Heath RH16 2LQ
| Today | See what it's worth now |
| 6 Mar 2026 | £834,500 |
| 24 Oct 2003 | £400,000 |
20, Speedwell Drive, Haywards Heath RH16 2FY
| Today | See what it's worth now |
| 6 Mar 2026 | £535,000 |
| 27 Mar 2015 | £384,995 |
No other historical records.
79, William Allen Lane, Haywards Heath RH16 2ST

| Today | See what it's worth now |
| 25 Feb 2026 | £367,600 |
| 3 Jun 1997 | £81,500 |
No other historical records.
8, The Oaks, Haywards Heath RH16 3ST
| Today | See what it's worth now |
| 23 Feb 2026 | £625,000 |
| 28 Feb 2020 | £470,000 |
No other historical records.
12, Finches Park Road, Haywards Heath RH16 2DN
| Today | See what it's worth now |
| 13 Feb 2026 | £729,000 |
| 12 Dec 2013 | £420,000 |
No other historical records.
47, Lexington Drive, Haywards Heath RH16 3UN
| Today | See what it's worth now |
| 13 Feb 2026 | £210,000 |
| 7 Aug 2020 | £195,000 |
134, The Welkin, Haywards Heath RH16 2PL
| Today | See what it's worth now |
| 11 Feb 2026 | £540,000 |
| 15 Mar 2005 | £315,000 |
No other historical records.
Woodridge House, Roundwood Lane, Haywards Heath RH16 1SJ
| Today | See what it's worth now |
| 10 Feb 2026 | £1,825,000 |
| 14 Nov 2017 | £1,300,000 |
56, Blackthorns, Haywards Heath RH16 2AY
| Today | See what it's worth now |
| 9 Feb 2026 | £920,000 |
| 14 Jun 2013 | £420,000 |
No other historical records.
1 Rosemoor, Oakfield Close, Haywards Heath RH16 2BJ
| Today | See what it's worth now |
| 9 Feb 2026 | £597,500 |
| 31 Aug 2007 | £349,950 |
No other historical records.
53, Savill Road, Haywards Heath RH16 2NW
| Today | See what it's worth now |
| 6 Feb 2026 | £470,000 |
| 7 Sep 2001 | £165,000 |
No other historical records.
53, Gatesmead, Haywards Heath RH16 1SN
| Today | See what it's worth now |
| 5 Feb 2026 | £795,000 |
| 27 Jun 2022 | £775,000 |
19, West Common Drive, Haywards Heath RH16 2AN

| Today | See what it's worth now |
| 4 Feb 2026 | £1,400,000 |
| 19 Sep 2014 | £800,000 |
Source Acknowledgement: © Crown copyright. England and Wales house price data is publicly available information produced by the HM Land Registry.This material was last updated on 9 July 2026. It covers the period from 1 January 1995 to 30 April 2026 and contains property transactions which have been registered during that period. Contains HM Land Registry data © Crown copyright and database right 2026. This data is licensed under the Open Government Licence v3.0.
Disclaimer: Rightmove.co.uk provides this HM Land Registry data "as is". The burden for fitness of the data relies completely with the user and is provided for informational purposes only. No warranty, express or implied, is given relating to the accuracy of content of the HM Land Registry data and Rightmove does not accept any liability for error or omission. If you have found an error with the data or need further information please contact HM Land Registry.
Permitted Use: Viewers of this Information are granted permission to access this Crown copyright material and to download it onto electronic, magnetic, optical or similar storage media provided that such activities are for private research, study or in-house use only. Any other use of the material requires the formal written permission of Land Registry which can be requested from us, and is subject to an additional licence and associated charge.
Rightmove takes no liability for your use of, or reliance on, Rightmove's Instant Valuation due to the limitations of our tracking tool listed here. Use of this tool is taken entirely at your own risk. All rights reserved.