
House Prices in LN9
House prices in LN9 have an overall average of £256,391 over the last year.
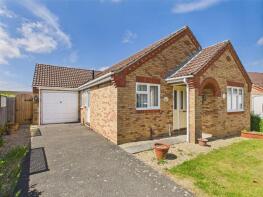
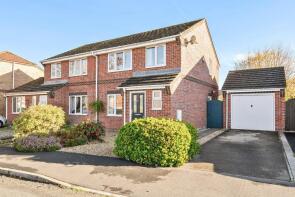
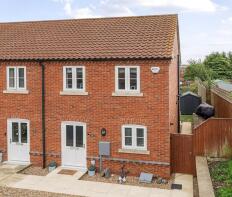
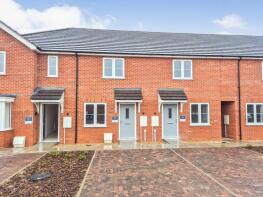
The majority of properties sold in LN9 during the last year were detached properties, selling for an average price of £324,186. Terraced properties sold for an average of £165,533, with semi-detached properties fetching £198,314.
Overall, the historical sold prices in LN9 over the last year were 3% down on the previous year and 2% up on the 2023 peak of £250,259.
Properties Sold
28, Bells Yard Close, Horncastle LN9 5BT
| Today | See what it's worth now |
| 24 Apr 2026 | £205,000 |
| 12 Mar 2021 | £189,950 |
Spring Meadow Farm, Green Lane, Horncastle LN9 5QH
| Today | See what it's worth now |
| 13 Apr 2026 | £300,000 |
| 30 May 2003 | £300,000 |
No other historical records.
46a October Cottage, South Street, Horncastle LN9 6EF
| Today | See what it's worth now |
| 25 Mar 2026 | £130,000 |
| 30 May 2019 | £99,950 |
Extensions and planning permission in LN9
See planning approval stats, extension build costs and value added estimates.

34 Croft House, Queen Street, Horncastle LN9 6BG
| Today | See what it's worth now |
| 20 Mar 2026 | £355,500 |
| 23 Dec 1999 | £87,500 |
No other historical records.
1, Fairfax Close, Horncastle LN9 6RD
| Today | See what it's worth now |
| 20 Mar 2026 | £250,000 |
| 24 Mar 2000 | £76,000 |
No other historical records.
38, Lodington Court, Horncastle LN9 6RZ
| Today | See what it's worth now |
| 20 Mar 2026 | £180,000 |
| 6 Jan 2006 | £130,000 |
2, Grundys Court, Horncastle LN9 5JD

| Today | See what it's worth now |
| 20 Mar 2026 | £122,500 |
| 26 Feb 2010 | £78,500 |
13, Cowling Close, Horncastle LN9 6QY
| Today | See what it's worth now |
| 13 Mar 2026 | £159,000 |
| 22 Aug 2018 | £132,000 |
13, Malsters Drive, Horncastle LN9 5FH
| Today | See what it's worth now |
| 13 Mar 2026 | £313,000 |
| 16 Dec 2024 | £299,950 |
No other historical records.
38, Malt Kiln Crescent, Horncastle LN9 5FJ
| Today | See what it's worth now |
| 9 Mar 2026 | £162,500 |
| 30 Nov 2023 | £159,950 |
No other historical records.
37, Stanhope Road, Horncastle LN9 5EL
| Today | See what it's worth now |
| 2 Mar 2026 | £218,000 |
| 3 Mar 2021 | £140,000 |
No other historical records.
Asterby Lodge, New End, Hemingby LN9 5QQ
| Today | See what it's worth now |
| 27 Feb 2026 | £200,000 |
No other historical records.
3, St Marys Square, Horncastle LN9 5HJ
| Today | See what it's worth now |
| 23 Feb 2026 | £140,000 |
| 15 Oct 1998 | £49,950 |
61, Spilsby Road, Horncastle LN9 6AW
| Today | See what it's worth now |
| 20 Feb 2026 | £190,000 |
| 2 Oct 2014 | £151,035 |
71, West Street, Horncastle LN9 5AF

| Today | See what it's worth now |
| 20 Feb 2026 | £150,000 |
| 9 Feb 2021 | £130,000 |
No other historical records.
4, Silver Street, Minting LN9 5RP
| Today | See what it's worth now |
| 17 Feb 2026 | £226,000 |
No other historical records.
Palavas, New End, Horncastle LN9 5QQ
| Today | See what it's worth now |
| 16 Feb 2026 | £363,500 |
| 24 Jan 2002 | £128,000 |
No other historical records.
90, Banovallum Gardens, Horncastle LN9 6RF
| Today | See what it's worth now |
| 13 Feb 2026 | £239,950 |
| 15 Jun 2023 | £245,000 |
19, The Sidings, Horncastle LN9 5UA
| Today | See what it's worth now |
| 12 Feb 2026 | £227,500 |
| 14 Nov 2002 | £125,000 |
No other historical records.
6, Wesley Way, Horncastle LN9 6RY
| Today | See what it's worth now |
| 6 Feb 2026 | £270,000 |
| 4 Nov 2013 | £155,000 |
2, Watsons Yard, Horncastle LN9 5JG
| Today | See what it's worth now |
| 6 Feb 2026 | £150,000 |
| 22 Jul 2022 | £150,000 |
The Satchels, Ings Lane, Belchford LN9 6LP

| Today | See what it's worth now |
| 4 Feb 2026 | £462,500 |
No other historical records.
31, Holly Close, Horncastle LN9 5EX
| Today | See what it's worth now |
| 3 Feb 2026 | £130,000 |
No other historical records.
Source Acknowledgement: © Crown copyright. England and Wales house price data is publicly available information produced by the HM Land Registry.This material was last updated on 9 July 2026. It covers the period from 1 January 1995 to 30 April 2026 and contains property transactions which have been registered during that period. Contains HM Land Registry data © Crown copyright and database right 2026. This data is licensed under the Open Government Licence v3.0.
Disclaimer: Rightmove.co.uk provides this HM Land Registry data "as is". The burden for fitness of the data relies completely with the user and is provided for informational purposes only. No warranty, express or implied, is given relating to the accuracy of content of the HM Land Registry data and Rightmove does not accept any liability for error or omission. If you have found an error with the data or need further information please contact HM Land Registry.
Permitted Use: Viewers of this Information are granted permission to access this Crown copyright material and to download it onto electronic, magnetic, optical or similar storage media provided that such activities are for private research, study or in-house use only. Any other use of the material requires the formal written permission of Land Registry which can be requested from us, and is subject to an additional licence and associated charge.
Rightmove takes no liability for your use of, or reliance on, Rightmove's Instant Valuation due to the limitations of our tracking tool listed here. Use of this tool is taken entirely at your own risk. All rights reserved.