
House Prices in Loveclough
House prices in Loveclough have an overall average of £263,578 over the last year.
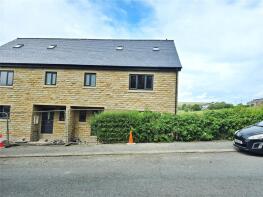
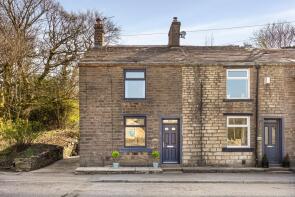
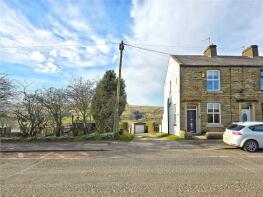
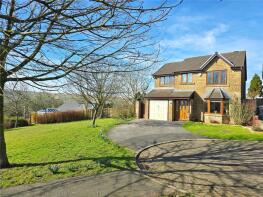
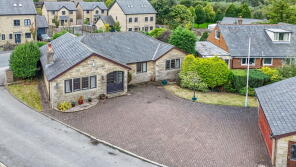
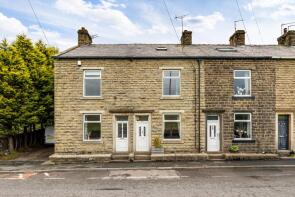
The majority of properties sold in Loveclough during the last year were detached properties, selling for an average price of £341,700. Terraced properties sold for an average of £196,545, with semi-detached properties fetching £249,250.
Overall, the historical sold prices in Loveclough over the last year were 18% down on the previous year and 11% down on the 2022 peak of £295,396.
Properties Sold
18, Middlegate Green, Loveclough, Rossendale BB4 8PY
| Today | See what it's worth now |
| 13 Apr 2026 | £341,000 |
| 23 Jun 1995 | £66,000 |
No other historical records.
10, Meadows Drive, Loveclough, Rossendale BB4 8FF
| Today | See what it's worth now |
| 23 Mar 2026 | £442,500 |
| 24 Apr 2003 | £139,995 |
No other historical records.
10, Chapel View, Loveclough, Rossendale BB4 8FN
| Today | See what it's worth now |
| 19 Feb 2026 | £310,000 |
| 7 Oct 2022 | £320,000 |
5, Gambleside Close, Loveclough, Rossendale BB4 8PU

| Today | See what it's worth now |
| 6 Feb 2026 | £189,000 |
| 14 Feb 2014 | £90,000 |
No other historical records.
1049, Burnley Road, Loveclough, Rossendale BB4 8QY
| Today | See what it's worth now |
| 18 Jan 2026 | £173,500 |
| 20 Oct 2011 | £105,000 |
5, Commercial Street, Loveclough, Rossendale BB4 8QX
| Today | See what it's worth now |
| 14 Jan 2026 | £215,000 |
| 5 Aug 2022 | £185,500 |
1079, Burnley Road, Loveclough, Rossendale BB4 8QY
| Today | See what it's worth now |
| 19 Dec 2025 | £223,000 |
| 25 Jul 2022 | £213,500 |
1292, Burnley Road, Loveclough, Rossendale BB4 8RG
| Today | See what it's worth now |
| 15 Dec 2025 | £209,950 |
| 20 Oct 2006 | £119,950 |
11, Cranberry Rise, Loveclough, Rossendale BB4 8FB

| Today | See what it's worth now |
| 12 Dec 2025 | £385,000 |
| 30 Oct 1998 | £107,950 |
No other historical records.
76, Hameldon Road, Loveclough, Rossendale BB4 8RL
| Today | See what it's worth now |
| 11 Dec 2025 | £325,000 |
| 26 Aug 2022 | £240,000 |
No other historical records.
847, Burnley Road, Loveclough, Rossendale BB4 8QL

| Today | See what it's worth now |
| 10 Dec 2025 | £275,000 |
No other historical records.
5, Fairbank Walk, Loveclough, Rossendale BB4 8FA
| Today | See what it's worth now |
| 8 Dec 2025 | £405,000 |
| 4 Apr 2003 | £155,000 |
2 Shawcroft, Goodshawfold Close, Loveclough, Rossendale BB4 8PZ
| Today | See what it's worth now |
| 20 Nov 2025 | £363,000 |
| 21 Aug 2000 | £150,000 |
No other historical records.
1275, Burnley Road, Loveclough, Rossendale BB4 8RG
| Today | See what it's worth now |
| 10 Oct 2025 | £200,000 |
| 11 Sep 2020 | £152,500 |
1293, Burnley Road, Loveclough, Rossendale BB4 8RG
| Today | See what it's worth now |
| 3 Oct 2025 | £220,500 |
No other historical records.
50, Goodshaw Avenue, Loveclough, Rossendale BB4 8PX
| Today | See what it's worth now |
| 3 Oct 2025 | £135,000 |
| 28 Jul 2006 | £54,000 |
No other historical records.
12, Cranberry Rise, Loveclough, Rossendale BB4 8FB
| Today | See what it's worth now |
| 15 Aug 2025 | £331,000 |
| 5 Oct 2000 | £103,000 |
1374, Burnley Road, Loveclough, Rossendale BB4 8RG
| Today | See what it's worth now |
| 15 Aug 2025 | £190,000 |
No other historical records.
3, Riverbank Mews, Penny Lodge Lane, Loveclough, Rossendale BB4 8TP
| Today | See what it's worth now |
| 8 Aug 2025 | £210,000 |
| 14 Jan 2022 | £198,000 |
7, Hempshaw Avenue, Loveclough, Rossendale BB4 8RW
| Today | See what it's worth now |
| 8 Aug 2025 | £255,000 |
| 30 Oct 2015 | £143,000 |
116, Goodshaw Avenue North, Loveclough, Rossendale BB4 8RH
| Today | See what it's worth now |
| 30 Jul 2025 | £235,000 |
No other historical records.
915, Burnley Road, Loveclough, Rossendale BB4 8QL

| Today | See what it's worth now |
| 18 Jul 2025 | £155,000 |
| 20 Oct 2015 | £95,000 |
24, Great Clough Drive, Loveclough, Rossendale BB4 8XP
| Today | See what it's worth now |
| 18 Jul 2025 | £310,000 |
| 29 Sep 2023 | £309,995 |
No other historical records.
Source Acknowledgement: © Crown copyright. England and Wales house price data is publicly available information produced by the HM Land Registry.This material was last updated on 9 July 2026. It covers the period from 1 January 1995 to 30 April 2026 and contains property transactions which have been registered during that period. Contains HM Land Registry data © Crown copyright and database right 2026. This data is licensed under the Open Government Licence v3.0.
Disclaimer: Rightmove.co.uk provides this HM Land Registry data "as is". The burden for fitness of the data relies completely with the user and is provided for informational purposes only. No warranty, express or implied, is given relating to the accuracy of content of the HM Land Registry data and Rightmove does not accept any liability for error or omission. If you have found an error with the data or need further information please contact HM Land Registry.
Permitted Use: Viewers of this Information are granted permission to access this Crown copyright material and to download it onto electronic, magnetic, optical or similar storage media provided that such activities are for private research, study or in-house use only. Any other use of the material requires the formal written permission of Land Registry which can be requested from us, and is subject to an additional licence and associated charge.
Rightmove takes no liability for your use of, or reliance on, Rightmove's Instant Valuation due to the limitations of our tracking tool listed here. Use of this tool is taken entirely at your own risk. All rights reserved.