
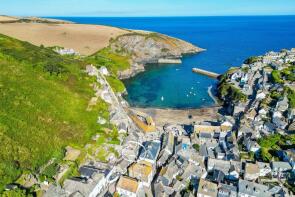
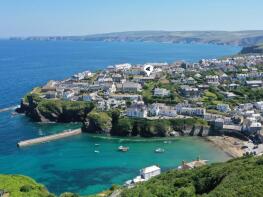
House Prices in Lower Trefreock
House prices in Lower Trefreock have an overall average of £407,958 over the last year.
The majority of properties sold in Lower Trefreock during the last year were detached properties, selling for an average price of £419,500. Terraced properties sold for an average of £359,500, with semi-detached properties fetching £555,000.
Overall, the historical sold prices in Lower Trefreock over the last year were 20% down on the previous year and 41% down on the 2022 peak of £691,867.
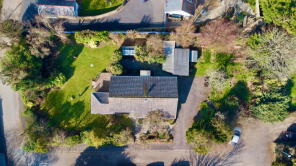
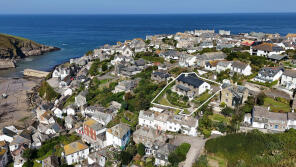
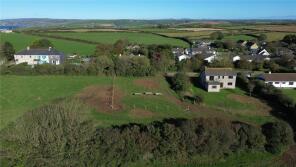
Properties Sold
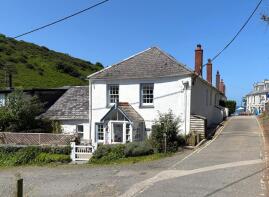
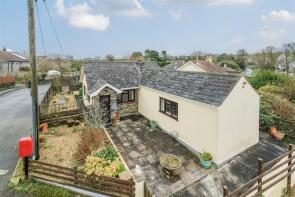
65 Sunnyside, Fore Street, Port Isaac PL29 3RF
| Today | See what it's worth now |
| 23 Mar 2026 | £655,000 |
| 30 Oct 2009 | £417,500 |
13, The Terrace, Port Isaac PL29 3SG
| Today | See what it's worth now |
| 27 Feb 2026 | £480,000 |
| 3 Dec 2010 | £825,000 |
No other historical records.
78, Fore Street, Port Isaac PL29 3RF
| Today | See what it's worth now |
| 27 Feb 2026 | £300,000 |
No other historical records.
5, Mayfield Road, Port Isaac PL29 3RT
| Today | See what it's worth now |
| 27 Nov 2025 | £570,000 |
| 2 Jun 2006 | £192,500 |
No other historical records.
Shrub Cottage, Green Door Cottages, Port Gaverne, Port Isaac PL29 3SQ
| Today | See what it's worth now |
| 18 Nov 2025 | £540,000 |
| 4 Oct 2013 | £272,500 |
8, Church Hill, Port Isaac PL29 3RQ
| Today | See what it's worth now |
| 17 Oct 2025 | £250,000 |
| 4 May 2018 | £315,000 |
8a Little Beside, Lundy Road, Port Isaac PL29 3RR
| Today | See what it's worth now |
| 17 Oct 2025 | £187,500 |
| 20 Mar 2008 | £399,950 |
No other historical records.
6, Marshalls Way, Trelights, Port Isaac PL29 3TE
| Today | See what it's worth now |
| 3 Oct 2025 | £410,000 |
| 4 Dec 2003 | £225,000 |
58, New Road, Port Isaac PL29 3SD
| Today | See what it's worth now |
| 26 Sep 2025 | £345,000 |
| 29 Jun 2021 | £250,000 |
12, Lundy Road, Port Isaac PL29 3RR
| Today | See what it's worth now |
| 8 Sep 2025 | £325,000 |
| 18 Jan 2006 | £184,000 |
94, Fore Street, Port Isaac PL29 3RF
| Today | See what it's worth now |
| 22 Aug 2025 | £333,000 |
| 5 Jan 2024 | £380,000 |
1, Furze Park, Trelights, Port Isaac PL29 3TG
| Today | See what it's worth now |
| 12 Jun 2025 | £500,000 |
| 16 May 2000 | £146,000 |
No other historical records.
Meadow Stile, Trewetha Lane, Port Isaac PL29 3RN
| Today | See what it's worth now |
| 23 May 2025 | £1,200,000 |
| 3 Apr 2018 | £775,000 |
No other historical records.
Rotuma, Road From Chapel Villa To Rose Cottage, Trelights, Port Isaac PL29 3TQ

| Today | See what it's worth now |
| 31 Mar 2025 | £650,000 |
| 3 Aug 2004 | £290,000 |
76, Fore Street, Port Isaac PL29 3RE

| Today | See what it's worth now |
| 21 Mar 2025 | £425,000 |
| 25 Sep 2006 | £295,000 |
Fearless, Fore Street, Port Isaac PL29 3RB
| Today | See what it's worth now |
| 21 Mar 2025 | £360,000 |
No other historical records.
Queens Land, Trelights, Port Isaac PL29 3TF
| Today | See what it's worth now |
| 28 Feb 2025 | £555,000 |
No other historical records.
Postbox Cottage, Road From The Barton To St Endellion Lane, Trelights, Port Isaac PL29 3TG
| Today | See what it's worth now |
| 20 Feb 2025 | £225,000 |
| 7 Oct 1997 | £59,950 |
No other historical records.
13 Valencia House, Trewetha Lane, Port Isaac PL29 3RN
| Today | See what it's worth now |
| 24 Jan 2025 | £1,055,000 |
| 18 Jun 2021 | £1,100,000 |
30, Dolphin Street, Port Isaac PL29 3RJ
| Today | See what it's worth now |
| 20 Dec 2024 | £387,500 |
| 15 Aug 2017 | £235,000 |
No other historical records.
12, Church Hill, Port Isaac PL29 3RQ
| Today | See what it's worth now |
| 18 Dec 2024 | £610,000 |
No other historical records.
Aubrey Grange, Road From The Barton To Junction West Of Tregole, Trelights, Port Isaac PL29 3TH

| Today | See what it's worth now |
| 22 Nov 2024 | £565,000 |
| 26 Jun 2016 | £335,000 |
No other historical records.
2, Marshalls Way, Trelights, Port Isaac PL29 3TE
| Today | See what it's worth now |
| 22 Nov 2024 | £435,000 |
| 5 Oct 2001 | £143,000 |
No other historical records.

Source Acknowledgement: © Crown copyright. England and Wales house price data is publicly available information produced by the HM Land Registry.This material was last updated on 15 May 2026. It covers the period from 1 January 1995 to 31 March 2026 and contains property transactions which have been registered during that period. Contains HM Land Registry data © Crown copyright and database right 2026. This data is licensed under the Open Government Licence v3.0.
Disclaimer: Rightmove.co.uk provides this HM Land Registry data "as is". The burden for fitness of the data relies completely with the user and is provided for informational purposes only. No warranty, express or implied, is given relating to the accuracy of content of the HM Land Registry data and Rightmove does not accept any liability for error or omission. If you have found an error with the data or need further information please contact HM Land Registry.
Permitted Use: Viewers of this Information are granted permission to access this Crown copyright material and to download it onto electronic, magnetic, optical or similar storage media provided that such activities are for private research, study or in-house use only. Any other use of the material requires the formal written permission of Land Registry which can be requested from us, and is subject to an additional licence and associated charge.
Map data ©OpenStreetMap contributors.
Rightmove takes no liability for your use of, or reliance on, Rightmove's Instant Valuation due to the limitations of our tracking tool listed here. Use of this tool is taken entirely at your own risk. All rights reserved.