
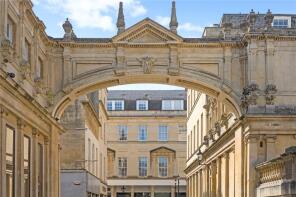
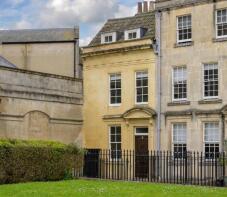
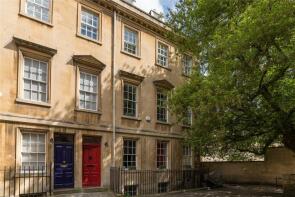
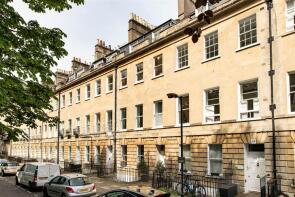
House Prices in Lyncombe Vale
House prices in Lyncombe Vale have an overall average of £310,833 over the last year.
Overall, the historical sold prices in Lyncombe Vale over the last year were 32% down on the previous year and 30% down on the 2023 peak of £441,446.
Properties Sold
Flat 2, 3, Southgate Street, City Centre, Bath BA1 1AQ
| Today | See what it's worth now |
| 2 Feb 2026 | £136,000 |
No other historical records.
Flat 18, 3, Southgate Street, City Centre, Bath BA1 1AQ
| Today | See what it's worth now |
| 19 Dec 2025 | £271,000 |
| 20 Nov 2015 | £275,000 |
4, Riverside Gardens, City Centre, Bath BA1 1XA
| Today | See what it's worth now |
| 12 Dec 2025 | £281,000 |
| 25 Feb 2022 | £280,000 |
52, Rosewell Court, City Centre, Bath BA1 2AQ
| Today | See what it's worth now |
| 7 Nov 2025 | £250,000 |
| 20 Oct 2006 | £160,000 |
Garden Flat, 7, Princes Street, City Centre, Bath BA1 1HL
| Today | See what it's worth now |
| 5 Sep 2025 | £252,000 |
| 25 Mar 2008 | £160,000 |
Flat 1, 1, Bilbury Lane, City Centre, Bath BA1 1AZ
| Today | See what it's worth now |
| 25 Jul 2025 | £675,000 |
| 12 Nov 2015 | £645,000 |
No other historical records.
31, Monmouth Street, City Centre, Bath BA1 2AN
| Today | See what it's worth now |
| 26 Jun 2025 | £557,470 |
No other historical records.
31, Green Park, Kingsmead, Bath BA1 1HZ

| Today | See what it's worth now |
| 6 May 2025 | £535,000 |
| 17 Oct 2011 | £390,000 |
Flat 1, 2, Harington Place, City Centre, Bath BA1 1HF
| Today | See what it's worth now |
| 31 Mar 2025 | £160,000 |
No other historical records.
Second Floor, 16, Pierrepont Street, City Centre, Bath BA1 1LA
| Today | See what it's worth now |
| 25 Mar 2025 | £275,000 |
| 31 Jul 1997 | £42,000 |
No other historical records.
6, Beauford Square, City Centre, Bath BA1 1HJ
| Today | See what it's worth now |
| 19 Mar 2025 | £650,000 |
No other historical records.
6, North Parade Buildings, City Centre, Bath BA1 1NS
| Today | See what it's worth now |
| 6 Mar 2025 | £1,300,000 |
| 22 Dec 2008 | £785,000 |
No other historical records.
Flat 2a, 29, Green Park, Kingsmead, Bath BA1 1HZ
| Today | See what it's worth now |
| 28 Feb 2025 | £275,000 |
No other historical records.
Lower Ground Floor, 30, Green Park, Kingsmead, Bath BA1 1HZ
| Today | See what it's worth now |
| 27 Feb 2025 | £581,600 |
| 28 Sep 2021 | £590,000 |
37, Green Park, Kingsmead, Bath BA1 1HZ
| Today | See what it's worth now |
| 5 Feb 2025 | £385,000 |
| 30 Nov 2020 | £320,000 |
Flat 1 Basement, 33, Green Park, Kingsmead, Bath BA1 1HZ
| Today | See what it's worth now |
| 31 Jan 2025 | £605,000 |
| 15 Sep 2017 | £520,000 |
8, Riverside Gardens, City Centre, Bath BA1 1XA

| Today | See what it's worth now |
| 22 Nov 2024 | £278,000 |
| 27 Feb 2019 | £250,000 |
No other historical records.
Flat 2, 9, Pierrepont Street, City Centre, Bath BA1 1LA
| Today | See what it's worth now |
| 20 Nov 2024 | £290,000 |
| 22 Oct 2021 | £250,000 |
No other historical records.
Flat 2, Abbey House, Abbey Green, City Centre, Bath BA1 1NR

| Today | See what it's worth now |
| 29 Oct 2024 | £273,000 |
| 10 Jul 2001 | £80,000 |
No other historical records.
Flat 7, 1, New Marchant's Passage, City Centre, Bath BA1 1AR
| Today | See what it's worth now |
| 27 Sep 2024 | £300,000 |
| 4 Oct 2012 | £220,000 |
No other historical records.
Flat 4, 35, Green Park, Kingsmead, Bath BA1 1HZ
| Today | See what it's worth now |
| 16 Aug 2024 | £345,000 |
| 11 Nov 2015 | £325,000 |
Top Floor, Bridgwater House, Terrace Walk, City Centre, Bath BA1 1LN
| Today | See what it's worth now |
| 26 Apr 2024 | £280,000 |
| 31 Oct 2003 | £180,000 |
No other historical records.
8-9, St James's Parade, City Centre, Bath BA1 1UL

| Today | See what it's worth now |
| 6 Feb 2024 | £400,000 |
| 26 May 2006 | £220,000 |

Source Acknowledgement: © Crown copyright. England and Wales house price data is publicly available information produced by the HM Land Registry.This material was last updated on 15 May 2026. It covers the period from 1 January 1995 to 31 March 2026 and contains property transactions which have been registered during that period. Contains HM Land Registry data © Crown copyright and database right 2026. This data is licensed under the Open Government Licence v3.0.
Disclaimer: Rightmove.co.uk provides this HM Land Registry data "as is". The burden for fitness of the data relies completely with the user and is provided for informational purposes only. No warranty, express or implied, is given relating to the accuracy of content of the HM Land Registry data and Rightmove does not accept any liability for error or omission. If you have found an error with the data or need further information please contact HM Land Registry.
Permitted Use: Viewers of this Information are granted permission to access this Crown copyright material and to download it onto electronic, magnetic, optical or similar storage media provided that such activities are for private research, study or in-house use only. Any other use of the material requires the formal written permission of Land Registry which can be requested from us, and is subject to an additional licence and associated charge.
Rightmove takes no liability for your use of, or reliance on, Rightmove's Instant Valuation due to the limitations of our tracking tool listed here. Use of this tool is taken entirely at your own risk. All rights reserved.