
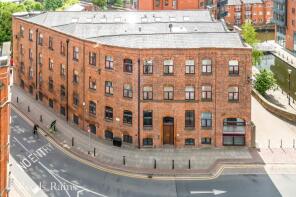
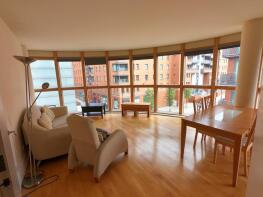
House Prices in M1
House prices in M1 have an overall average of £234,950 over the last year.
The majority of properties sold in M1 during the last year were flats, selling for an average price of £233,676. Terraced properties sold for an average of £381,500.
Overall, the historical sold prices in M1 over the last year were 24% down on the previous year and 17% down on the 2023 peak of £282,138.
Properties Sold
Flat 5, Cambridge Mill, Cambridge Street, Manchester M1 5GF

| Today | See what it's worth now |
| 13 Apr 2026 | £195,000 |
| 27 Mar 2015 | £160,000 |
Flat 10, 3, Dale Street, Manchester M1 1BA

| Today | See what it's worth now |
| 10 Apr 2026 | £300,000 |
| 9 Jun 2006 | £185,000 |
Flat 10, 40 Junction Works, Ducie Street, Manchester M1 2DF
| Today | See what it's worth now |
| 10 Apr 2026 | £305,000 |
| 30 Jul 2013 | £158,000 |
Extensions and planning permission in M1
See planning approval stats, extension build costs and value added estimates.

Flat 818, 51, Whitworth Street West, Manchester M1 5ED

| Today | See what it's worth now |
| 1 Apr 2026 | £203,500 |
| 23 Oct 2017 | £255,000 |
Flat 31, 48, Princess Street, Manchester M1 6HR
| Today | See what it's worth now |
| 30 Mar 2026 | £210,000 |
| 4 Nov 2014 | £175,000 |
Flat 34, 5 Stonebridge House, Cobourg Street, Manchester M1 3GB
| Today | See what it's worth now |
| 25 Mar 2026 | £240,000 |
| 5 Mar 2004 | £147,000 |
13, Lamport Court, Lamport Close, Manchester M1 7EQ

| Today | See what it's worth now |
| 23 Mar 2026 | £120,000 |
| 19 May 2017 | £106,000 |
No other historical records.
Flat 18, 16 Junction House, Jutland Street, Manchester M1 2DS
| Today | See what it's worth now |
| 23 Mar 2026 | £287,000 |
| 23 Oct 2003 | £226,400 |
No other historical records.
Flat 98, 83 The Sorting House, Newton Street, Manchester M1 1ER
| Today | See what it's worth now |
| 20 Mar 2026 | £317,500 |
| 3 Nov 2021 | £292,000 |
Flat B906, 50 Oxygen Tower, Store Street, Manchester M1 2FW
| Today | See what it's worth now |
| 19 Mar 2026 | £280,000 |
| 24 Mar 2022 | £321,389 |
No other historical records.
Flat B1306, 50 Oxygen Tower, Store Street, Manchester M1 2FW
| Today | See what it's worth now |
| 13 Mar 2026 | £250,000 |
No other historical records.
Flat 17, 59 Bombay House, Whitworth Street, Manchester M1 3AB
| Today | See what it's worth now |
| 6 Mar 2026 | £188,500 |
| 26 Oct 2007 | £142,500 |
Flat 8, 27, Whitworth Street West, Manchester M1 5ND

| Today | See what it's worth now |
| 3 Mar 2026 | £200,000 |
| 26 Aug 2022 | £166,200 |
Flat 401, 70 Crusader Mill, Chapeltown Street, Manchester M1 2EX

| Today | See what it's worth now |
| 27 Feb 2026 | £220,000 |
| 28 Jan 2022 | £210,000 |
No other historical records.
Apartment 308, 43 The Arthouse, George Street, Manchester M1 4AB
| Today | See what it's worth now |
| 27 Feb 2026 | £182,000 |
| 8 Mar 2004 | £116,500 |
No other historical records.
Flat 52, 15 Mercury Building, Aytoun Street, Manchester M1 3BL
| Today | See what it's worth now |
| 25 Feb 2026 | £320,000 |
| 22 Apr 2005 | £270,000 |
Flat 208, 90, Princess Street, Manchester M1 6NG
| Today | See what it's worth now |
| 25 Feb 2026 | £105,000 |
No other historical records.
Flat 7, 4 Lockes Yard, Great Marlborough Street, Manchester M1 5AL
| Today | See what it's worth now |
| 23 Feb 2026 | £270,000 |
| 13 Sep 2006 | £215,000 |
Flat 3, 20 Navigation House, Ducie Street, Manchester M1 2DP
| Today | See what it's worth now |
| 23 Feb 2026 | £225,000 |
| 16 Apr 2021 | £218,000 |
Flat 19, Junction House, Jutland Street, Manchester M1 2DS
| Today | See what it's worth now |
| 19 Feb 2026 | £270,000 |
| 10 Dec 2003 | £223,960 |
No other historical records.
Flat 62, 144 Princess House, Princess Street, Manchester M1 7EP

| Today | See what it's worth now |
| 19 Feb 2026 | £170,000 |
| 19 Feb 2026 | £170,000 |
16, James Brindley Basin, Manchester M1 2NL
| Today | See what it's worth now |
| 17 Feb 2026 | £275,000 |
| 7 Dec 2020 | £252,500 |
Flat 77, 83 The Sorting House, Newton Street, Manchester M1 1ER
| Today | See what it's worth now |
| 16 Feb 2026 | £288,000 |
| 20 Sep 2017 | £245,000 |
No other historical records.
Source Acknowledgement: © Crown copyright. England and Wales house price data is publicly available information produced by the HM Land Registry.This material was last updated on 9 July 2026. It covers the period from 1 January 1995 to 30 April 2026 and contains property transactions which have been registered during that period. Contains HM Land Registry data © Crown copyright and database right 2026. This data is licensed under the Open Government Licence v3.0.
Disclaimer: Rightmove.co.uk provides this HM Land Registry data "as is". The burden for fitness of the data relies completely with the user and is provided for informational purposes only. No warranty, express or implied, is given relating to the accuracy of content of the HM Land Registry data and Rightmove does not accept any liability for error or omission. If you have found an error with the data or need further information please contact HM Land Registry.
Permitted Use: Viewers of this Information are granted permission to access this Crown copyright material and to download it onto electronic, magnetic, optical or similar storage media provided that such activities are for private research, study or in-house use only. Any other use of the material requires the formal written permission of Land Registry which can be requested from us, and is subject to an additional licence and associated charge.
Rightmove takes no liability for your use of, or reliance on, Rightmove's Instant Valuation due to the limitations of our tracking tool listed here. Use of this tool is taken entirely at your own risk. All rights reserved.