
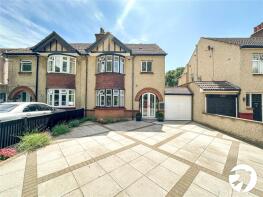
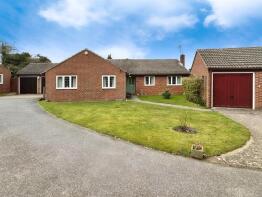
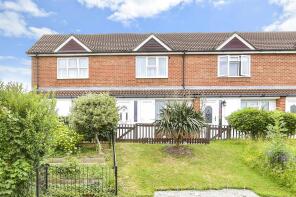
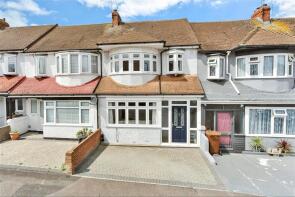
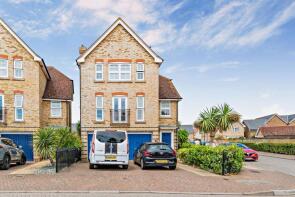
House Prices in ME4
House prices in ME4 have an overall average of £294,249 over the last year.
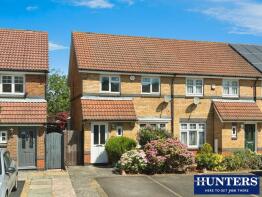
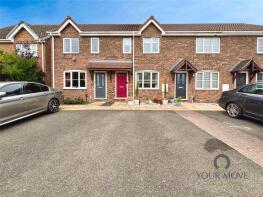
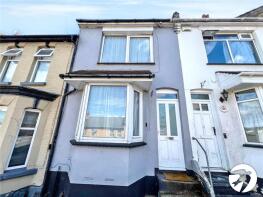
The majority of properties sold in ME4 during the last year were terraced properties, selling for an average price of £285,150. Flats sold for an average of £191,855, with semi-detached properties fetching £382,227.
Overall, the historical sold prices in ME4 over the last year were 4% up on the previous year and 1% down on the 2022 peak of £298,464.
Properties Sold
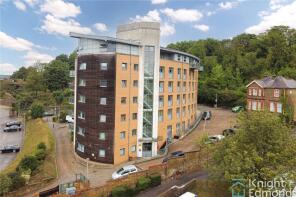
Flat 35, The Eye, Barrier Road, Chatham ME4 4SD
| Today | See what it's worth now |
| 17 Apr 2026 | £200,000 |
| 30 Jun 2016 | £188,000 |
9, Port Rise, Chatham ME4 6QA
| Today | See what it's worth now |
| 16 Apr 2026 | £325,000 |
| 11 Jul 1997 | £81,950 |
No other historical records.
3, Stonecrop Close, St Marys Island, Chatham ME4 3HA
| Today | See what it's worth now |
| 16 Apr 2026 | £307,000 |
| 30 Mar 2023 | £295,000 |
Extensions and planning permission in ME4
See planning approval stats, extension build costs and value added estimates.

29, Central Park Gardens, Chatham ME4 6UT

| Today | See what it's worth now |
| 16 Apr 2026 | £307,500 |
| 18 Mar 2021 | £235,000 |
No other historical records.
91, Magpie Hall Road, Chatham ME4 5NB
| Today | See what it's worth now |
| 13 Apr 2026 | £217,000 |
| 16 Jul 2021 | £175,000 |
5a, Springfield Terrace, Chatham ME4 6BL
| Today | See what it's worth now |
| 10 Apr 2026 | £125,000 |
| 30 Aug 2018 | £125,000 |
45, Chamberlain Road, Luton, Chatham ME4 5HT
| Today | See what it's worth now |
| 30 Mar 2026 | £190,000 |
| 22 Jan 2020 | £190,000 |
52, The Wharf, Dock Head Road, Chatham Maritime, Chatham ME4 4ZN

| Today | See what it's worth now |
| 30 Mar 2026 | £160,750 |
| 26 Feb 2009 | £178,000 |
No other historical records.
89, Marina Point West, Dock Head Road, Chatham Maritime, Chatham ME4 4ZF

| Today | See what it's worth now |
| 27 Mar 2026 | £185,000 |
| 24 Apr 2020 | £183,000 |
14d, Spembley House, New Road Avenue, Chatham ME4 6BA
| Today | See what it's worth now |
| 27 Mar 2026 | £84,000 |
| 2 Jan 2015 | £103,000 |
No other historical records.
16, Sallow Close, St Marys Island, Chatham ME4 3HG
| Today | See what it's worth now |
| 20 Mar 2026 | £335,000 |
| 29 May 2025 | £323,000 |
178, Maidstone Road, Chatham ME4 6EN
| Today | See what it's worth now |
| 19 Mar 2026 | £486,500 |
| 11 May 2001 | £111,999 |
No other historical records.
26, Bournville Avenue, Chatham ME4 6LR
| Today | See what it's worth now |
| 16 Mar 2026 | £525,000 |
| 27 Mar 1997 | £104,000 |
No other historical records.
28, New Road, Chatham ME4 4QR

| Today | See what it's worth now |
| 13 Mar 2026 | £495,000 |
| 19 Jan 2018 | £300,000 |
No other historical records.
10, Primrose Close, Horsted, Chatham ME4 6HZ
| Today | See what it's worth now |
| 13 Mar 2026 | £590,000 |
| 7 Jun 2006 | £295,000 |
No other historical records.
12, Brompton Hill, Brompton, Chatham ME4 4XG
| Today | See what it's worth now |
| 9 Mar 2026 | £244,000 |
| 20 Sep 2019 | £187,000 |
50, The Wharf, Dock Head Road, Chatham Maritime, Chatham ME4 4ZN

| Today | See what it's worth now |
| 4 Mar 2026 | £155,000 |
| 21 Dec 2015 | £154,995 |
4, Redshank Road, St Marys Island, Chatham ME4 3NX

| Today | See what it's worth now |
| 27 Feb 2026 | £475,000 |
| 11 Jul 2024 | £465,000 |
50, Blenheim Avenue, Chatham ME4 6UX
| Today | See what it's worth now |
| 27 Feb 2026 | £350,000 |
| 10 Sep 2015 | £187,000 |
No other historical records.
36, East Street, Chatham ME4 5NJ
| Today | See what it's worth now |
| 27 Feb 2026 | £225,000 |
| 30 Oct 2024 | £175,000 |
21, Kitchener Avenue, Chatham ME4 5XP
| Today | See what it's worth now |
| 27 Feb 2026 | £295,000 |
No other historical records.
12, Portside View, Chatham ME4 4FY
| Today | See what it's worth now |
| 26 Feb 2026 | £400,500 |
| 15 Jul 2022 | £425,000 |
No other historical records.
Flat 49, Atlas Place, Wilkey Way, St Marys Island, Chatham ME4 3AN
| Today | See what it's worth now |
| 24 Feb 2026 | £260,000 |
| 16 Jun 2022 | £205,000 |
No other historical records.

Source Acknowledgement: © Crown copyright. England and Wales house price data is publicly available information produced by the HM Land Registry.This material was last updated on 9 July 2026. It covers the period from 1 January 1995 to 30 April 2026 and contains property transactions which have been registered during that period. Contains HM Land Registry data © Crown copyright and database right 2026. This data is licensed under the Open Government Licence v3.0.
Disclaimer: Rightmove.co.uk provides this HM Land Registry data "as is". The burden for fitness of the data relies completely with the user and is provided for informational purposes only. No warranty, express or implied, is given relating to the accuracy of content of the HM Land Registry data and Rightmove does not accept any liability for error or omission. If you have found an error with the data or need further information please contact HM Land Registry.
Permitted Use: Viewers of this Information are granted permission to access this Crown copyright material and to download it onto electronic, magnetic, optical or similar storage media provided that such activities are for private research, study or in-house use only. Any other use of the material requires the formal written permission of Land Registry which can be requested from us, and is subject to an additional licence and associated charge.
Rightmove takes no liability for your use of, or reliance on, Rightmove's Instant Valuation due to the limitations of our tracking tool listed here. Use of this tool is taken entirely at your own risk. All rights reserved.