
House Prices in Mile House
House prices in Mile House have an overall average of £209,488 over the last year.
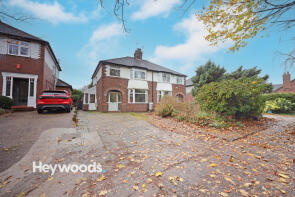
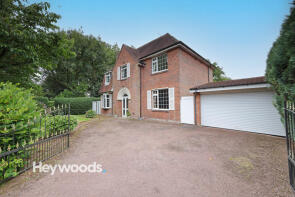
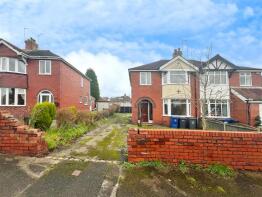
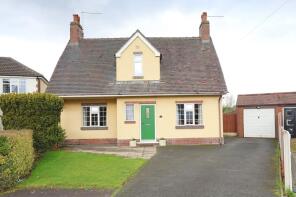
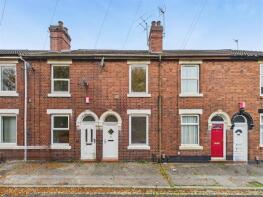
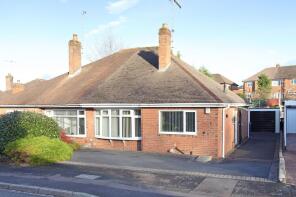
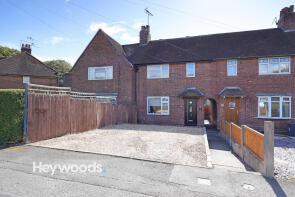
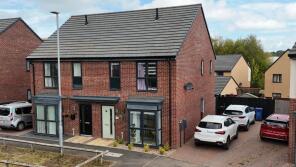
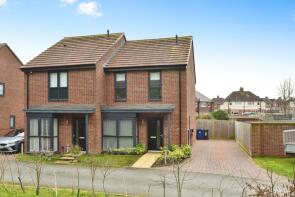
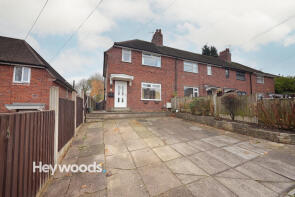
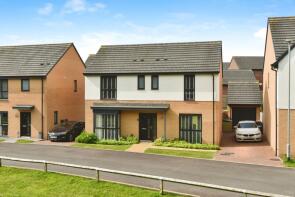
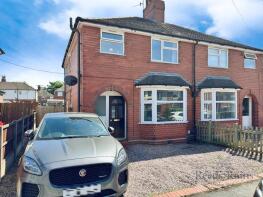
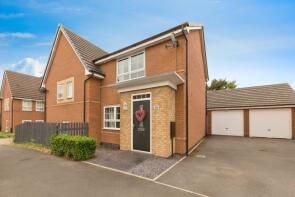
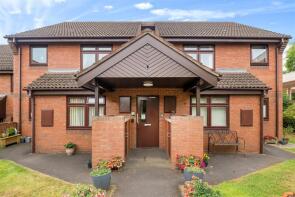
The majority of properties sold in Mile House during the last year were semi-detached properties, selling for an average price of £215,511. Terraced properties sold for an average of £150,493, with detached properties fetching £339,118.
Overall, the historical sold prices in Mile House over the last year were similar to the previous year and 3% up on the 2022 peak of £202,549.
Properties Sold
8, Enderley Street, Newcastle ST5 2DE
| Today | See what it's worth now |
| 20 Mar 2026 | £118,000 |
| 29 Jul 2015 | £82,000 |
52, Thistleberry Avenue, Newcastle ST5 2LT

| Today | See what it's worth now |
| 27 Feb 2026 | £156,000 |
| 19 Mar 2015 | £105,500 |
No other historical records.
125, The Mill, Newcastle ST5 2AN
| Today | See what it's worth now |
| 27 Feb 2026 | £135,000 |
| 20 Dec 2007 | £125,000 |
No other historical records.
2, Fell Avenue, Newcastle ST5 9FR
| Today | See what it's worth now |
| 23 Feb 2026 | £183,000 |
| 27 Mar 2020 | £154,995 |
25, Seabridge Road, Newcastle ST5 2HU
| Today | See what it's worth now |
| 20 Feb 2026 | £272,000 |
| 4 Dec 2020 | £159,300 |
38, Seabridge Road, Newcastle ST5 2HT
| Today | See what it's worth now |
| 19 Feb 2026 | £245,000 |
| 11 May 2020 | £172,250 |
No other historical records.
1, Chantry Road, Newcastle Under Lyme ST5 2EU
| Today | See what it's worth now |
| 17 Feb 2026 | £560,000 |
No other historical records.
24, St Michaels Road, Cross Heath, Newcastle ST5 9LW
| Today | See what it's worth now |
| 16 Feb 2026 | £190,000 |
| 13 Aug 2021 | £150,000 |
No other historical records.
57, Heath Avenue, Newcastle Under Lyme ST5 9NU
| Today | See what it's worth now |
| 11 Feb 2026 | £154,000 |
No other historical records.
5, Berne Avenue, Newcastle ST5 2QJ

| Today | See what it's worth now |
| 11 Feb 2026 | £490,000 |
| 8 Nov 2016 | £376,000 |
18a, High Street, Newcastle Under Lyme ST5 1RA
| Today | See what it's worth now |
| 9 Feb 2026 | £90,000 |
| 11 Oct 2019 | £50,000 |
No other historical records.
12, Galingale View, Newcastle ST5 2GR

| Today | See what it's worth now |
| 3 Feb 2026 | £270,000 |
| 23 Feb 2024 | £253,000 |
14, St Anthonys Drive, Newcastle ST5 2JE
| Today | See what it's worth now |
| 30 Jan 2026 | £310,000 |
| 23 Oct 2020 | £264,000 |
No other historical records.
8, Baden Street, Newcastle ST5 9EL
| Today | See what it's worth now |
| 30 Jan 2026 | £110,000 |
| 28 Sep 2012 | £62,000 |
6, Brookside Close, Newcastle ST5 2HX
| Today | See what it's worth now |
| 30 Jan 2026 | £265,000 |
| 3 Feb 2006 | £180,000 |
74, St Michaels Road, Cross Heath, Newcastle ST5 9LR
| Today | See what it's worth now |
| 30 Jan 2026 | £185,000 |
| 18 Aug 2023 | £150,000 |
6, Shetland Drive, Newcastle ST5 9FQ
| Today | See what it's worth now |
| 23 Jan 2026 | £236,000 |
| 11 Sep 2020 | £188,995 |
No other historical records.
16, Fell Avenue, Newcastle Under Lyme ST5 9FR
| Today | See what it's worth now |
| 22 Jan 2026 | £85,000 |
No other historical records.
6, St Georges Road, Newcastle ST5 2NE
| Today | See what it's worth now |
| 20 Jan 2026 | £135,000 |
| 30 Oct 1998 | £33,500 |
No other historical records.
13a, King Street, Cross Heath, Newcastle ST5 9HQ

| Today | See what it's worth now |
| 16 Jan 2026 | £132,000 |
| 18 Mar 2015 | £90,000 |
64, Shetland Drive, Newcastle ST5 9FQ
| Today | See what it's worth now |
| 9 Jan 2026 | £320,000 |
| 9 Jul 2021 | £271,000 |
No other historical records.
16, Hollinshead Avenue, Newcastle ST5 9DD
| Today | See what it's worth now |
| 7 Jan 2026 | £177,500 |
| 8 Jun 2018 | £142,000 |
26, Navigation Way, Cross Heath, Newcastle ST5 9HJ
| Today | See what it's worth now |
| 6 Jan 2026 | £179,500 |
| 10 Jun 2014 | £120,000 |

Source Acknowledgement: © Crown copyright. England and Wales house price data is publicly available information produced by the HM Land Registry.This material was last updated on 15 May 2026. It covers the period from 1 January 1995 to 31 March 2026 and contains property transactions which have been registered during that period. Contains HM Land Registry data © Crown copyright and database right 2026. This data is licensed under the Open Government Licence v3.0.
Disclaimer: Rightmove.co.uk provides this HM Land Registry data "as is". The burden for fitness of the data relies completely with the user and is provided for informational purposes only. No warranty, express or implied, is given relating to the accuracy of content of the HM Land Registry data and Rightmove does not accept any liability for error or omission. If you have found an error with the data or need further information please contact HM Land Registry.
Permitted Use: Viewers of this Information are granted permission to access this Crown copyright material and to download it onto electronic, magnetic, optical or similar storage media provided that such activities are for private research, study or in-house use only. Any other use of the material requires the formal written permission of Land Registry which can be requested from us, and is subject to an additional licence and associated charge.
Rightmove takes no liability for your use of, or reliance on, Rightmove's Instant Valuation due to the limitations of our tracking tool listed here. Use of this tool is taken entirely at your own risk. All rights reserved.