
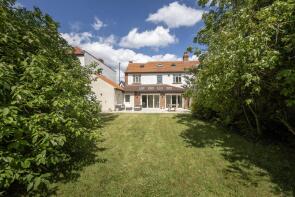
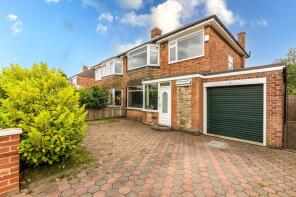
House Prices in Montagu
House prices in Montagu have an overall average of £433,033 over the last year.
The majority of properties sold in Montagu during the last year were semi-detached properties, selling for an average price of £476,432. Terraced properties sold for an average of £454,093, with flats fetching £243,074.
Overall, the historical sold prices in Montagu over the last year were similar to the previous year and 16% down on the 2023 peak of £513,469.
Properties Sold
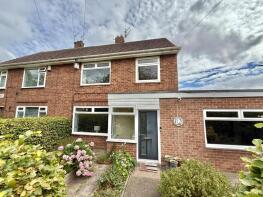
12, Kenton Lodge, Kenton Road, Newcastle Upon Tyne NE3 4PE
| Today | See what it's worth now |
| 19 Feb 2026 | £200,000 |
| 10 Jun 2016 | £254,999 |
No other historical records.
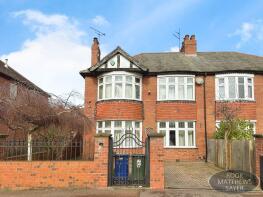
13, North Avenue, Gosforth, Newcastle Upon Tyne NE3 4DT
| Today | See what it's worth now |
| 9 Feb 2026 | £1,126,000 |
No other historical records.
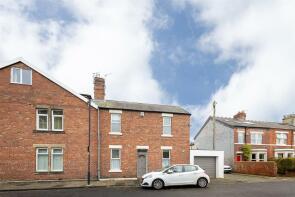
14, Darwin Crescent, Newcastle Upon Tyne NE3 4TT
| Today | See what it's worth now |
| 30 Jan 2026 | £177,950 |
| 26 Jul 2021 | £156,000 |
19, Kenton Road, Kenton, Newcastle Upon Tyne NE3 4NE
| Today | See what it's worth now |
| 30 Jan 2026 | £760,000 |
No other historical records.
14, Moor Place, Gosforth, Newcastle Upon Tyne NE3 4AL
| Today | See what it's worth now |
| 28 Jan 2026 | £740,000 |
| 4 Nov 2003 | £400,000 |
No other historical records.
35, Elmfield Grove, Gosforth, Newcastle Upon Tyne NE3 4XA
| Today | See what it's worth now |
| 23 Jan 2026 | £395,000 |
| 25 Aug 2023 | £372,500 |
25, The Uplands, Newcastle Upon Tyne NE3 4LH
| Today | See what it's worth now |
| 16 Jan 2026 | £360,000 |
| 30 Mar 2007 | £232,000 |
20, The Wynd, Kenton, Newcastle Upon Tyne NE3 4LA
| Today | See what it's worth now |
| 9 Jan 2026 | £335,000 |
| 8 Sep 2014 | £235,000 |
22, Ashfield Road, Gosforth, Newcastle Upon Tyne NE3 4XL

| Today | See what it's worth now |
| 19 Dec 2025 | £220,000 |
| 13 Mar 2020 | £165,000 |
No other historical records.
5, Elmfield Gardens, Gosforth, Newcastle Upon Tyne NE3 4XB
| Today | See what it's worth now |
| 18 Dec 2025 | £615,000 |
| 30 Sep 2019 | £320,000 |
No other historical records.
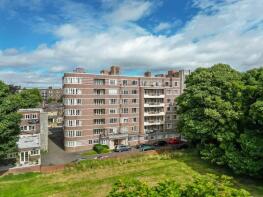
35, Lanesborough Court, Newcastle Upon Tyne NE3 3BZ
| Today | See what it's worth now |
| 17 Dec 2025 | £335,000 |
| 21 Nov 2019 | £292,500 |
11, Hawthorn Court, Hawthorn Road, Gosforth, Newcastle Upon Tyne NE3 4TZ
| Today | See what it's worth now |
| 15 Dec 2025 | £215,000 |
| 1 Oct 2012 | £202,000 |
21, Wyndfall Way, Newcastle Upon Tyne NE3 4QJ
| Today | See what it's worth now |
| 12 Dec 2025 | £185,000 |
| 16 Nov 2020 | £130,000 |
2, The Garth, Kenton, Newcastle Upon Tyne NE3 4LL


| Today | See what it's worth now |
| 12 Dec 2025 | £350,000 |
| 6 May 2015 | £224,500 |
3, Aysgarth Green, Newcastle Upon Tyne NE3 4PQ
| Today | See what it's worth now |
| 12 Dec 2025 | £230,500 |
| 12 Mar 2019 | £170,000 |
No other historical records.
4, Rokeby Drive, Newcastle Upon Tyne NE3 4JX
| Today | See what it's worth now |
| 12 Dec 2025 | £278,000 |
| 20 Dec 2018 | £248,000 |
No other historical records.
1, Wolsingham Road, Gosforth, Newcastle Upon Tyne NE3 4RP
| Today | See what it's worth now |
| 10 Dec 2025 | £236,000 |
| 29 Nov 2012 | £148,000 |
54, Moor Court, Westfield, Gosforth, Newcastle Upon Tyne NE3 4YD
| Today | See what it's worth now |
| 28 Nov 2025 | £300,000 |
| 30 Mar 2016 | £290,000 |
97, Kenton Road, Newcastle Upon Tyne NE3 4NL
| Today | See what it's worth now |
| 28 Nov 2025 | £847,500 |
| 13 Mar 2008 | £480,000 |
No other historical records.
24, Oakfield Terrace, Gosforth, Newcastle Upon Tyne NE3 4RQ

| Today | See what it's worth now |
| 28 Nov 2025 | £395,000 |
| 31 May 2007 | £180,000 |
No other historical records.
30, Kenton Lodge, Kenton Road, Newcastle Upon Tyne NE3 4PE

| Today | See what it's worth now |
| 26 Nov 2025 | £205,000 |
| 31 Aug 2017 | £259,999 |
No other historical records.
6, Eddleston Avenue, Newcastle Upon Tyne NE3 4SJ
| Today | See what it's worth now |
| 24 Nov 2025 | £445,000 |
| 27 Jun 2019 | £290,000 |
19, Graham Park Road, Gosforth, Newcastle Upon Tyne NE3 4BH
| Today | See what it's worth now |
| 21 Nov 2025 | £1,900,000 |
| 28 Apr 2009 | £1,350,000 |
No other historical records.
41, Wolsingham Road, Gosforth, Newcastle Upon Tyne NE3 4RP
| Today | See what it's worth now |
| 21 Nov 2025 | £449,000 |
| 16 Dec 2014 | £298,000 |
30, Ashfield Road, Gosforth, Newcastle Upon Tyne NE3 4XL
| Today | See what it's worth now |
| 20 Nov 2025 | £190,500 |
| 7 Aug 2015 | £163,400 |
Source Acknowledgement: © Crown copyright. England and Wales house price data is publicly available information produced by the HM Land Registry.This material was last updated on 9 April 2026. It covers the period from 1 January 1995 to 27 February 2026 and contains property transactions which have been registered during that period. Contains HM Land Registry data © Crown copyright and database right 2026. This data is licensed under the Open Government Licence v3.0.
Disclaimer: Rightmove.co.uk provides this HM Land Registry data "as is". The burden for fitness of the data relies completely with the user and is provided for informational purposes only. No warranty, express or implied, is given relating to the accuracy of content of the HM Land Registry data and Rightmove does not accept any liability for error or omission. If you have found an error with the data or need further information please contact HM Land Registry.
Permitted Use: Viewers of this Information are granted permission to access this Crown copyright material and to download it onto electronic, magnetic, optical or similar storage media provided that such activities are for private research, study or in-house use only. Any other use of the material requires the formal written permission of Land Registry which can be requested from us, and is subject to an additional licence and associated charge.
Map data ©OpenStreetMap contributors.
Rightmove takes no liability for your use of, or reliance on, Rightmove's Instant Valuation due to the limitations of our tracking tool listed here. Use of this tool is taken entirely at your own risk. All rights reserved.