
House Prices in NE34
House prices in NE34 have an overall average of £184,480 over the last year.
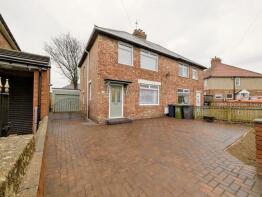
The majority of properties sold in NE34 during the last year were semi-detached properties, selling for an average price of £202,714. Terraced properties sold for an average of £146,443, with flats fetching £94,172.
Overall, the historical sold prices in NE34 over the last year were similar to the previous year and 7% up on the 2023 peak of £173,091.
Properties Sold
19, Benton Road, South Shields NE34 9UD
| Today | See what it's worth now |
| 24 Apr 2026 | £110,000 |
| 12 Jul 2013 | £65,000 |
No other historical records.
33, Peel Gardens, South Shields NE34 9EN

| Today | See what it's worth now |
| 17 Apr 2026 | £112,000 |
| 29 May 2020 | £90,700 |
18, South Avenue, South Shields NE34 6RA
| Today | See what it's worth now |
| 14 Apr 2026 | £180,000 |
| 18 Feb 2026 | £235,000 |
No other historical records.
Extensions and planning permission in NE34
See planning approval stats, extension build costs and value added estimates.

163, Lumley Avenue, South Shields NE34 7DJ

| Today | See what it's worth now |
| 14 Apr 2026 | £168,000 |
No other historical records.
139, Harton House Road, South Shields NE34 6EA
| Today | See what it's worth now |
| 10 Apr 2026 | £195,000 |
| 18 Nov 2022 | £152,500 |
66, Felton Avenue, South Shields NE34 6RY
| Today | See what it's worth now |
| 10 Apr 2026 | £213,000 |
| 11 Sep 2009 | £123,500 |
10, Shaw Avenue, South Shields NE34 9ST
| Today | See what it's worth now |
| 10 Apr 2026 | £108,800 |
| 6 Apr 2001 | £33,000 |
11, Carroll Walk, South Shields NE34 9LN
| Today | See what it's worth now |
| 8 Apr 2026 | £118,000 |
| 20 Jan 2006 | £75,000 |
15, Bisley Drive, South Shields NE34 0PY
| Today | See what it's worth now |
| 2 Apr 2026 | £153,000 |
| 7 Jun 2022 | £105,000 |
No other historical records.
21, Harton Rise, South Shields NE34 6DY
| Today | See what it's worth now |
| 2 Apr 2026 | £200,000 |
| 30 Apr 2021 | £159,000 |
62, Lynwood Way, South Shields NE34 8DB
| Today | See what it's worth now |
| 2 Apr 2026 | £240,000 |
| 18 Aug 2023 | £230,000 |
21, High Meadow, South Shields NE34 6JG
| Today | See what it's worth now |
| 2 Apr 2026 | £222,000 |
| 19 Jan 2024 | £167,000 |
No other historical records.
2, Ayrey Avenue, South Shields NE34 9EG
| Today | See what it's worth now |
| 2 Apr 2026 | £120,000 |
| 12 Apr 2006 | £97,950 |
No other historical records.
163, Harton House Road, South Shields NE34 6EA
| Today | See what it's worth now |
| 30 Mar 2026 | £283,500 |
| 18 Oct 2019 | £200,000 |
32, Mulberry Crescent, South Shields NE34 8DD
| Today | See what it's worth now |
| 27 Mar 2026 | £192,000 |
| 14 Nov 2008 | £144,875 |
No other historical records.
11, Norfolk Road, South Shields NE34 7JN

| Today | See what it's worth now |
| 27 Mar 2026 | £252,000 |
No other historical records.
21, East Avenue, South Shields NE34 6PB
| Today | See what it's worth now |
| 27 Mar 2026 | £110,000 |
| 12 Feb 2018 | £67,000 |
24, Lilac Avenue, South Shields NE34 7PF
| Today | See what it's worth now |
| 27 Mar 2026 | £199,950 |
| 2 Oct 2003 | £75,950 |
5, Birdhill Place, South Shields NE34 0YA
| Today | See what it's worth now |
| 27 Mar 2026 | £111,000 |
No other historical records.
14, Hyperion Avenue, South Shields NE34 9AE
| Today | See what it's worth now |
| 26 Mar 2026 | £167,000 |
| 25 Oct 1996 | £50,000 |
No other historical records.
38, East Avenue, South Shields NE34 6NX
| Today | See what it's worth now |
| 26 Mar 2026 | £126,000 |
| 28 Sep 2018 | £67,500 |
16, Renoir Gardens, South Shields NE34 8HT

| Today | See what it's worth now |
| 26 Mar 2026 | £122,000 |
| 8 Apr 2021 | £90,000 |
No other historical records.
82, Hylton Avenue, South Shields NE34 7SF
| Today | See what it's worth now |
| 26 Mar 2026 | £225,000 |
| 31 Jul 2020 | £165,000 |
Source Acknowledgement: © Crown copyright. England and Wales house price data is publicly available information produced by the HM Land Registry.This material was last updated on 9 July 2026. It covers the period from 1 January 1995 to 30 April 2026 and contains property transactions which have been registered during that period. Contains HM Land Registry data © Crown copyright and database right 2026. This data is licensed under the Open Government Licence v3.0.
Disclaimer: Rightmove.co.uk provides this HM Land Registry data "as is". The burden for fitness of the data relies completely with the user and is provided for informational purposes only. No warranty, express or implied, is given relating to the accuracy of content of the HM Land Registry data and Rightmove does not accept any liability for error or omission. If you have found an error with the data or need further information please contact HM Land Registry.
Permitted Use: Viewers of this Information are granted permission to access this Crown copyright material and to download it onto electronic, magnetic, optical or similar storage media provided that such activities are for private research, study or in-house use only. Any other use of the material requires the formal written permission of Land Registry which can be requested from us, and is subject to an additional licence and associated charge.
Rightmove takes no liability for your use of, or reliance on, Rightmove's Instant Valuation due to the limitations of our tracking tool listed here. Use of this tool is taken entirely at your own risk. All rights reserved.