
House Prices in Newbwrch
House prices in Newbwrch have an overall average of £218,325 over the last year.
The majority of properties sold in Newbwrch during the last year were detached properties, selling for an average price of £351,714. Terraced properties sold for an average of £146,243, with semi-detached properties fetching £178,325.
Overall, the historical sold prices in Newbwrch over the last year were similar to the previous year and 11% down on the 2021 peak of £245,349.
Properties Sold
1, Merddyn Gwyn, Brynsiencyn, Llanfair Pwllgwyngyll LL61 6UW
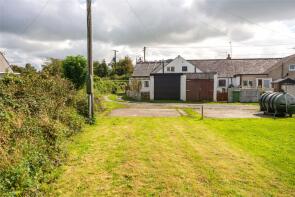
| Today | See what it's worth now |
| 6 Jun 2025 | £170,000 |
| 25 Apr 1997 | £35,000 |
No other historical records.
Minffordd Cottage, Newborough, Llanfair Pwllgwyngyll LL61 6RS
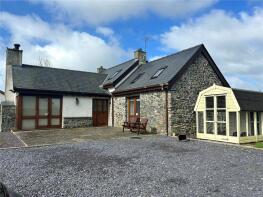
| Today | See what it's worth now |
| 23 May 2025 | £332,000 |
| 9 Dec 2013 | £268,000 |
4 De Ja Vu, Tyn Cwrt Estate, Brynsiencyn, Llanfairpwllgwyngyll LL61 6LJ
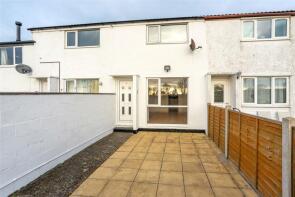
| Today | See what it's worth now |
| 25 Apr 2025 | £126,000 |
| 30 Nov 1999 | £30,000 |
2, Ffordd Gwenllian, Llanfairpwllgwyngyll LL61 5QD
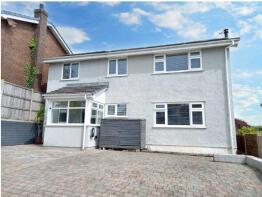
| Today | See what it's worth now |
| 17 Apr 2025 | £280,000 |
| 1 Jul 2005 | £130,000 |
6, Llys Marcwis, Holyhead Road, Llanfairpwllgwyngyll LL61 5TX
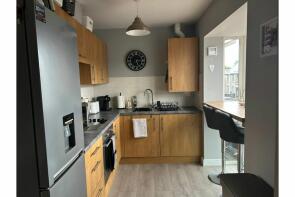
| Today | See what it's worth now |
| 16 Apr 2025 | £125,000 |
| 2 Jun 2023 | £120,000 |
1, Llys Marcwis, Holyhead Road, Llanfair Pwllgwyngyll LL61 5TX
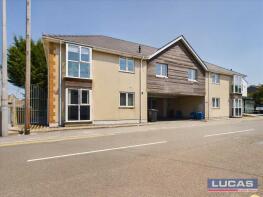
| Today | See what it's worth now |
| 4 Apr 2025 | £122,500 |
No other historical records.
7, High Street, Brynsiencyn, Llanfairpwllgwyngyll LL61 6UB

| Today | See what it's worth now |
| 21 Mar 2025 | £116,000 |
| 1 Apr 2011 | £52,000 |
No other historical records.
Trefnant Bach, A4080 From Clynnog To Junction Near Tal Ponciau, Dwyran, Llanfairpwllgwyngyll LL61 6RH
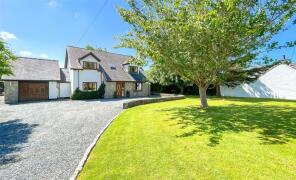
| Today | See what it's worth now |
| 5 Mar 2025 | £400,000 |
| 17 Oct 2013 | £355,000 |
Tan Y Fron, Pen Dref Street, Newborough, Llanfairpwllgwyngyll LL61 6SY
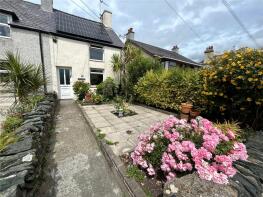
| Today | See what it's worth now |
| 3 Mar 2025 | £120,000 |
| 6 Mar 2023 | £165,000 |
27, Tre Rhosyr, Newborough, Llanfairpwllgwyngyll LL61 6TG

| Today | See what it's worth now |
| 10 Feb 2025 | £145,000 |
| 29 Oct 2003 | £61,950 |
No other historical records.
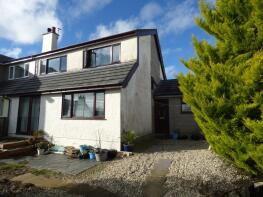
12, Taldrwst, Dwyran, Llanfair Pwllgwyngyll LL61 6YF
| Today | See what it's worth now |
| 7 Feb 2025 | £180,000 |
| 22 Apr 2016 | £50,000 |
No other historical records.
3, Stad Llain Capel, Newborough, Llanfairpwllgwyngyll LL61 6WG

| Today | See what it's worth now |
| 13 Dec 2024 | £335,000 |
| 27 Nov 2015 | £225,000 |
No other historical records.
Awelon, Church Street, Newborough, Llanfairpwllgwyngyll LL61 6SG

| Today | See what it's worth now |
| 13 Dec 2024 | £210,000 |
| 30 Nov 1998 | £48,500 |
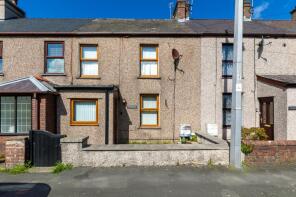
4, Fair View, Holyhead Road, Llanfair Pwllgwyngyll LL61 5YJ
| Today | See what it's worth now |
| 9 Dec 2024 | £154,000 |
No other historical records.
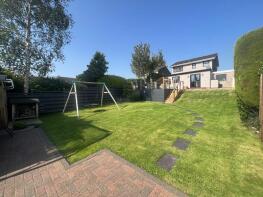
7, Ffordd Angharad, Llanfairpwllgwyngyll LL61 5QA
| Today | See what it's worth now |
| 22 Nov 2024 | �£310,000 |
| 21 Dec 2016 | £186,000 |
No other historical records.
16, Maes Hyfryd, Dwyran, Llanfairpwllgwyngyll LL61 6YH

| Today | See what it's worth now |
| 28 Oct 2024 | £180,000 |
| 24 Nov 2006 | £157,500 |
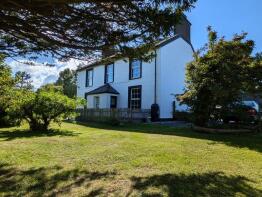
Bod Iorwerth, Chapel Street, Newborough, Llanfairpwllgwyngyll LL61 6RU
| Today | See what it's worth now |
| 25 Oct 2024 | £625,000 |
| 1 Aug 2016 | £280,000 |
No other historical records.
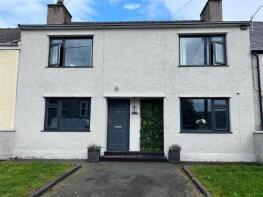
6 Gwyadre, Pen Dref Street, Newborough, Llanfairpwllgwyngyll LL61 6SY
| Today | See what it's worth now |
| 25 Oct 2024 | £225,000 |
| 1 Mar 2018 | £115,000 |
No other historical records.
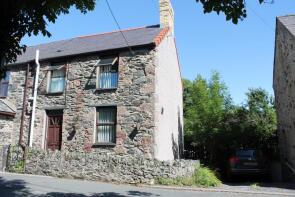
2, Graig Owen, Lon Fain, Dwyran, Llanfair Pwllgwyngyll LL61 6YG
| Today | See what it's worth now |
| 24 Oct 2024 | £135,000 |
No other historical records.
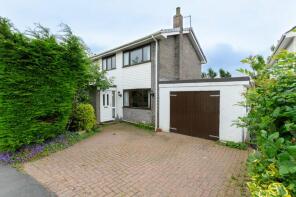
2, Ffordd Rhiannon, Llanfairpwllgwyngyll LL61 5QB
| Today | See what it's worth now |
| 3 Oct 2024 | £199,950 |
| 4 Oct 1996 | £54,000 |
No other historical records.
Bodwyn, Gorffwysfa, Dwyran, Llanfair Pwllgwyngyll LL61 6YJ

| Today | See what it's worth now |
| 23 Sep 2024 | £175,000 |
| 13 Nov 2002 | £68,950 |
1, Tyn Cwrt Estate, Brynsiencyn, Llanfairpwllgwyngyll LL61 6LJ

| Today | See what it's worth now |
| 20 Sep 2024 | £137,700 |
| 19 Jun 2019 | £84,211 |
13, Tyn Cwrt Estate, Brynsiencyn, Llanfairpwllgwyngyll LL61 6LJ

| Today | See what it's worth now |
| 30 Aug 2024 | £91,750 |
| 11 Jun 1999 | £31,500 |
No other historical records.
13, Llys Marcwis, Holyhead Road, Llanfairpwllgwyngyll LL61 5TX

| Today | See what it's worth now |
| 9 Aug 2024 | £128,000 |
| 20 Dec 2021 | £116,500 |
No other historical records.
2, Tyn Cwrt Estate, Brynsiencyn, Llanfairpwllgwyngyll LL61 6LJ

| Today | See what it's worth now |
| 2 Aug 2024 | £112,500 |
| 29 Mar 2019 | £82,500 |
Get ready with a Mortgage in Principle
- Personalised result in just 20 minutes
- Find out how much you can borrow
- Get viewings faster with agents
- No impact on your credit score
What's your property worth?
Source Acknowledgement: © Crown copyright. England and Wales house price data is publicly available information produced by the HM Land Registry.This material was last updated on 6 August 2025. It covers the period from 1 January 1995 to 30 June 2025 and contains property transactions which have been registered during that period. Contains HM Land Registry data © Crown copyright and database right 2025. This data is licensed under the Open Government Licence v3.0.
Disclaimer: Rightmove.co.uk provides this HM Land Registry data "as is". The burden for fitness of the data relies completely with the user and is provided for informational purposes only. No warranty, express or implied, is given relating to the accuracy of content of the HM Land Registry data and Rightmove does not accept any liability for error or omission. If you have found an error with the data or need further information please contact HM Land Registry.
Permitted Use: Viewers of this Information are granted permission to access this Crown copyright material and to download it onto electronic, magnetic, optical or similar storage media provided that such activities are for private research, study or in-house use only. Any other use of the material requires the formal written permission of Land Registry which can be requested from us, and is subject to an additional licence and associated charge.
Map data ©OpenStreetMap contributors.
Rightmove takes no liability for your use of, or reliance on, Rightmove's Instant Valuation due to the limitations of our tracking tool listed here. Use of this tool is taken entirely at your own risk. All rights reserved.
