
House Prices in NG11
House prices in NG11 have an overall average of £285,892 over the last year.
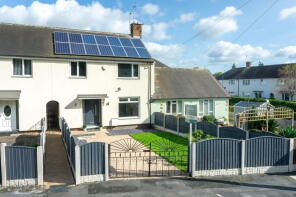
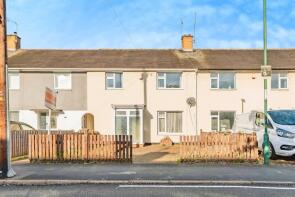
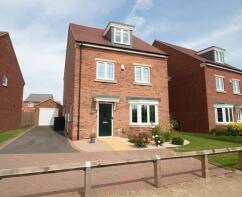
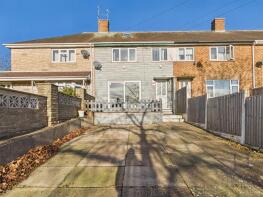
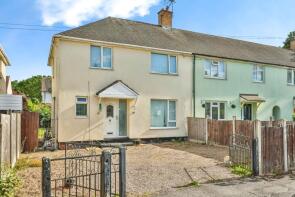
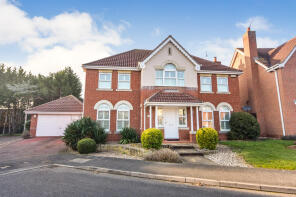
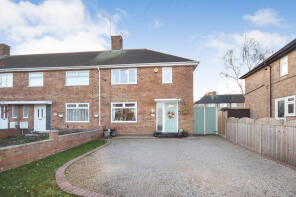
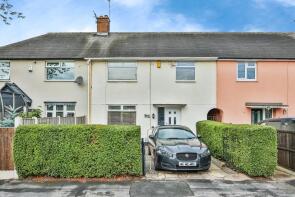
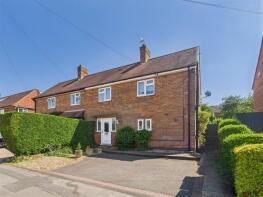
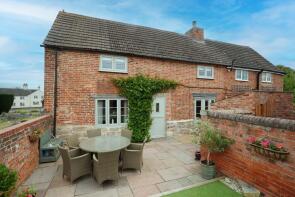
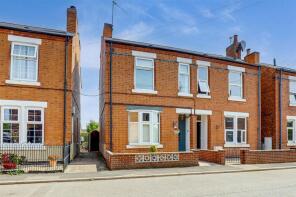
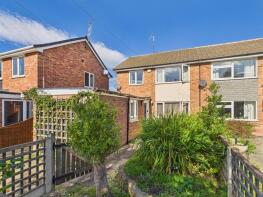
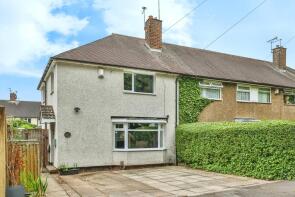
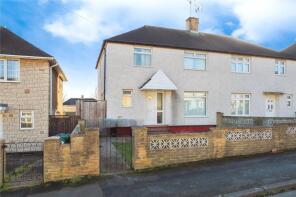
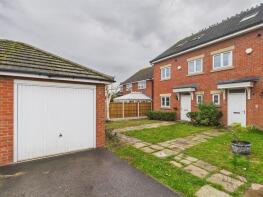
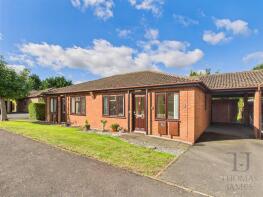
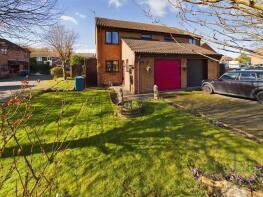
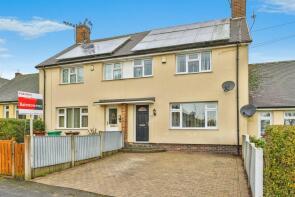
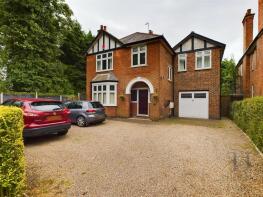
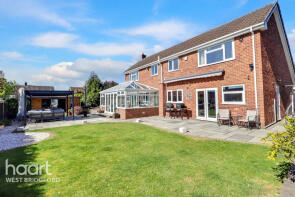
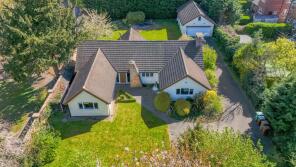
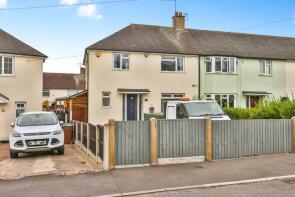
The majority of properties sold in NG11 during the last year were semi-detached properties, selling for an average price of £258,812. Terraced properties sold for an average of £217,105, with detached properties fetching £475,176.
Overall, the historical sold prices in NG11 over the last year were 8% down on the previous year and 6% down on the 2023 peak of £303,657.
Properties Sold
20, Breckswood Drive, Nottingham NG11 9ER
| Today | See what it's worth now |
| 17 Apr 2026 | £215,000 |
| 7 May 2021 | £135,000 |
No other historical records.
76, Wrenthorpe Vale, Nottingham NG11 9BY
| Today | See what it's worth now |
| 10 Apr 2026 | £175,000 |
| 29 Nov 2018 | £128,000 |
No other historical records.
1, Clevely Way, Nottingham NG11 8AY
| Today | See what it's worth now |
| 8 Apr 2026 | £198,000 |
| 1 Jul 2003 | £72,500 |
No other historical records.
Extensions and planning permission in NG11
See planning approval stats, extension build costs and value added estimates.

9, Anemone Grove, Nottingham NG11 6SB
| Today | See what it's worth now |
| 2 Apr 2026 | £530,000 |
| 31 May 2022 | £469,000 |
No other historical records.
24, Pinewood Gardens, Nottingham NG11 9GZ
| Today | See what it's worth now |
| 31 Mar 2026 | £187,000 |
| 5 Dec 2019 | £139,000 |
28, Conifer Crescent, Nottingham NG11 9EQ
| Today | See what it's worth now |
| 31 Mar 2026 | £195,000 |
| 5 Jan 2022 | £170,000 |
65, Glenlivet Gardens, Nottingham NG11 8QB
| Today | See what it's worth now |
| 31 Mar 2026 | £100,000 |
| 27 Mar 2020 | £131,000 |
9, Chancery Court, Nottingham NG11 7EQ
| Today | See what it's worth now |
| 31 Mar 2026 | £615,000 |
| 29 Jun 2012 | £342,500 |
109, Listowel Crescent, Nottingham NG11 9BP
| Today | See what it's worth now |
| 31 Mar 2026 | £235,000 |
| 1 May 2019 | £145,000 |
3, Blaise Close, Nottingham NG11 9BW
| Today | See what it's worth now |
| 30 Mar 2026 | £175,000 |
| 13 Jan 2017 | £102,500 |
56, St Marys Crescent, Ruddington NG11 6FR
| Today | See what it's worth now |
| 27 Mar 2026 | £310,000 |
No other historical records.
4, Church Street, Nottingham NG11 0JQ
| Today | See what it's worth now |
| 27 Mar 2026 | £289,000 |
| 2 Apr 2015 | £135,000 |
No other historical records.
6, Pygall Avenue, Gotham NG11 0JW
| Today | See what it's worth now |
| 27 Mar 2026 | £215,000 |
No other historical records.
17, Gladstone Avenue, Nottingham NG11 0HN
| Today | See what it's worth now |
| 27 Mar 2026 | £280,000 |
| 17 Dec 2019 | £218,000 |
No other historical records.
9, Savages Road, Nottingham NG11 6EW
| Today | See what it's worth now |
| 27 Mar 2026 | £251,700 |
| 21 Jan 2013 | £155,000 |
No other historical records.
89, Gardendale Avenue, Nottingham NG11 9HX
| Today | See what it's worth now |
| 27 Mar 2026 | £205,000 |
| 27 Jun 2014 | £110,000 |
85, Bransdale Road, Nottingham NG11 9JB
| Today | See what it's worth now |
| 25 Mar 2026 | £158,000 |
| 11 Sep 2015 | £102,000 |
3, Windmill Close, Nottingham NG11 0JF
| Today | See what it's worth now |
| 24 Mar 2026 | £275,000 |
| 15 Jun 2009 | £215,000 |
No other historical records.
6, Shrimpton Court, Nottingham NG11 6GY
| Today | See what it's worth now |
| 23 Mar 2026 | £240,000 |
| 7 Dec 2018 | £155,000 |
32, Sheepfold Lane, Nottingham NG11 6NS
| Today | See what it's worth now |
| 23 Mar 2026 | £279,500 |
| 21 Jun 2002 | £97,950 |
No other historical records.
108, Thistledown Road, Nottingham NG11 9EE
| Today | See what it's worth now |
| 23 Mar 2026 | £190,000 |
| 22 May 2020 | £150,000 |
36, Kirk Lane, Nottingham NG11 6NN
| Today | See what it's worth now |
| 20 Mar 2026 | £790,000 |
| 27 Sep 2021 | £751,000 |
8, Leabrook Close, Nottingham NG11 8NW
| Today | See what it's worth now |
| 20 Mar 2026 | £625,000 |
| 27 Jan 2012 | £241,000 |
No other historical records.
Source Acknowledgement: © Crown copyright. England and Wales house price data is publicly available information produced by the HM Land Registry.This material was last updated on 9 July 2026. It covers the period from 1 January 1995 to 30 April 2026 and contains property transactions which have been registered during that period. Contains HM Land Registry data © Crown copyright and database right 2026. This data is licensed under the Open Government Licence v3.0.
Disclaimer: Rightmove.co.uk provides this HM Land Registry data "as is". The burden for fitness of the data relies completely with the user and is provided for informational purposes only. No warranty, express or implied, is given relating to the accuracy of content of the HM Land Registry data and Rightmove does not accept any liability for error or omission. If you have found an error with the data or need further information please contact HM Land Registry.
Permitted Use: Viewers of this Information are granted permission to access this Crown copyright material and to download it onto electronic, magnetic, optical or similar storage media provided that such activities are for private research, study or in-house use only. Any other use of the material requires the formal written permission of Land Registry which can be requested from us, and is subject to an additional licence and associated charge.
Rightmove takes no liability for your use of, or reliance on, Rightmove's Instant Valuation due to the limitations of our tracking tool listed here. Use of this tool is taken entirely at your own risk. All rights reserved.