
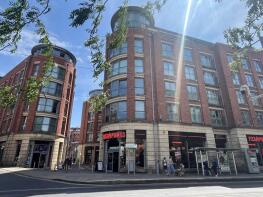
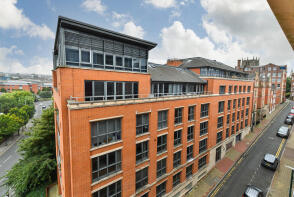
House Prices in NG1
House prices in NG1 have an overall average of £193,397 over the last year.
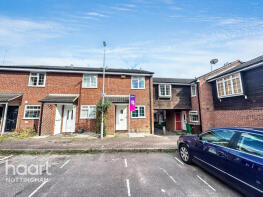
The majority of properties sold in NG1 during the last year were flats, selling for an average price of £186,774. Terraced properties sold for an average of £173,000, with semi-detached properties fetching £160,000.
Overall, the historical sold prices in NG1 over the last year were 14% up on the previous year and 5% down on the 2021 peak of £204,100.
Properties Sold
Flat 23, 21, Barker Gate, Nottingham NG1 1JU
| Today | See what it's worth now |
| 27 Mar 2026 | £200,000 |
| 8 Sep 2014 | £190,000 |
Flat 1, 22 Oxford Heights, The Ropewalk, Nottingham NG1 5DZ
| Today | See what it's worth now |
| 27 Mar 2026 | £240,000 |
| 26 Apr 2018 | £220,000 |
No other historical records.
Apartment 512, Nottingham One Entrance B, Canal Street, Nottingham NG1 7HW
| Today | See what it's worth now |
| 26 Mar 2026 | £160,000 |
| 15 May 2014 | £213,000 |
No other historical records.
Extensions and planning permission in NG1
See planning approval stats, extension build costs and value added estimates.

Apartment 31, 2 The Living Quarter, St Marys Gate, Nottingham NG1 1PF

| Today | See what it's worth now |
| 12 Mar 2026 | £125,000 |
| 7 Sep 2011 | £125,000 |
Apartment 6, 43 The Axis, Wollaton Street, Nottingham NG1 5FW

| Today | See what it's worth now |
| 9 Mar 2026 | £155,000 |
| 9 May 2012 | £125,000 |
No other historical records.
18, Regent Court, Derby Street, Nottingham NG1 5FF

| Today | See what it's worth now |
| 2 Mar 2026 | £95,000 |
| 5 Apr 2012 | £88,000 |
Flat 27, Halley House, Hounds Gate, Nottingham NG1 7AD

| Today | See what it's worth now |
| 27 Feb 2026 | £53,000 |
No other historical records.
Apartment 7, The Pinnacle, Cottage Terrace, Nottingham NG1 5AS
| Today | See what it's worth now |
| 27 Feb 2026 | £156,000 |
| 21 Jul 2017 | £191,000 |
Flat 9, 7 Lexington Place, Plumptre Street, Nottingham NG1 1AN
| Today | See what it's worth now |
| 20 Feb 2026 | £165,000 |
| 17 Sep 2002 | £168,200 |
No other historical records.
Flat 16, 6 The Point, Bellar Gate, Nottingham NG1 1JN

| Today | See what it's worth now |
| 13 Feb 2026 | £201,000 |
| 14 Sep 2018 | £175,000 |
Flat 38, 9 Lexington Place, Plumptre Street, Nottingham NG1 1AN
| Today | See what it's worth now |
| 5 Feb 2026 | £172,000 |
| 14 Feb 2013 | £108,000 |
Apartment 40, Number One Fletcher Gate, Adams Walk, Nottingham NG1 1QP
| Today | See what it's worth now |
| 30 Jan 2026 | £150,000 |
| 17 Dec 2004 | £217,000 |
No other historical records.
Apartment 5, 32 Broadway House, Stoney Street, Nottingham NG1 1LL

| Today | See what it's worth now |
| 30 Jan 2026 | £127,500 |
| 1 Jun 2018 | £118,000 |
30, Bluecoat Close, Nottingham NG1 4DP
| Today | See what it's worth now |
| 27 Jan 2026 | £233,000 |
| 12 Oct 2006 | £152,000 |
Apartment 21, 12 Stone Yard, Plumptre Street, Nottingham NG1 1JL
| Today | See what it's worth now |
| 23 Jan 2026 | £150,000 |
| 3 Nov 2010 | £142,000 |
Apartment 27, George Street Trading House, George Street, Nottingham NG1 3BU
| Today | See what it's worth now |
| 19 Jan 2026 | £80,000 |
| 5 Sep 2002 | £131,130 |
No other historical records.
Flat 54, 9 Lexington Place, Plumptre Street, Nottingham NG1 1AN
| Today | See what it's worth now |
| 9 Jan 2026 | £190,000 |
| 27 Jun 2003 | £238,307 |
No other historical records.
9, Matlock Court, Nottingham NG1 4DT
| Today | See what it's worth now |
| 5 Jan 2026 | £205,000 |
| 26 Oct 2018 | £152,500 |
No other historical records.
14, Matlock Court, Nottingham NG1 4DT
| Today | See what it's worth now |
| 19 Dec 2025 | £160,000 |
| 30 Sep 1998 | £64,000 |
No other historical records.
204, Park Gate, Upper College Street, Nottingham NG1 5AP
| Today | See what it's worth now |
| 18 Dec 2025 | £152,500 |
| 6 Dec 2011 | £122,000 |
Apartment 18, 3 The Establishment, Broadway, Nottingham NG1 1PR
| Today | See what it's worth now |
| 5 Dec 2025 | £160,000 |
| 31 Jan 2005 | £116,875 |
40, Regent Court, Derby Street, Nottingham NG1 5FF
| Today | See what it's worth now |
| 5 Dec 2025 | £89,100 |
| 15 Nov 2017 | £111,500 |
Apartment 18, 1a, Hollow Stone, Nottingham NG1 1JH
| Today | See what it's worth now |
| 4 Dec 2025 | £210,000 |
| 6 Oct 2006 | £177,000 |
Source Acknowledgement: © Crown copyright. England and Wales house price data is publicly available information produced by the HM Land Registry.This material was last updated on 9 July 2026. It covers the period from 1 January 1995 to 30 April 2026 and contains property transactions which have been registered during that period. Contains HM Land Registry data © Crown copyright and database right 2026. This data is licensed under the Open Government Licence v3.0.
Disclaimer: Rightmove.co.uk provides this HM Land Registry data "as is". The burden for fitness of the data relies completely with the user and is provided for informational purposes only. No warranty, express or implied, is given relating to the accuracy of content of the HM Land Registry data and Rightmove does not accept any liability for error or omission. If you have found an error with the data or need further information please contact HM Land Registry.
Permitted Use: Viewers of this Information are granted permission to access this Crown copyright material and to download it onto electronic, magnetic, optical or similar storage media provided that such activities are for private research, study or in-house use only. Any other use of the material requires the formal written permission of Land Registry which can be requested from us, and is subject to an additional licence and associated charge.
Rightmove takes no liability for your use of, or reliance on, Rightmove's Instant Valuation due to the limitations of our tracking tool listed here. Use of this tool is taken entirely at your own risk. All rights reserved.