
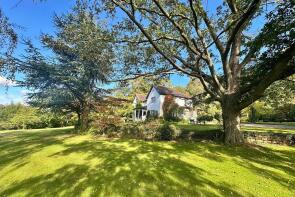
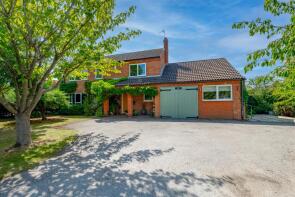
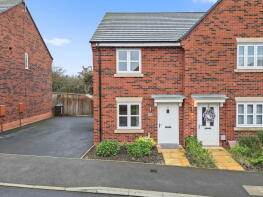
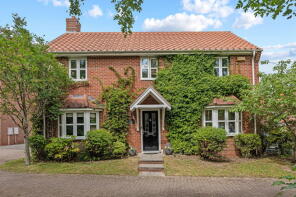
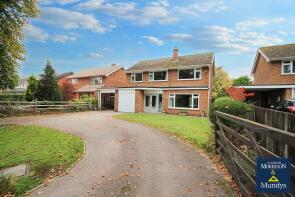
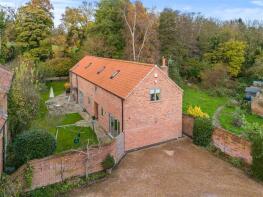
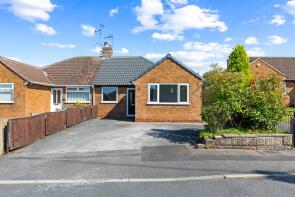
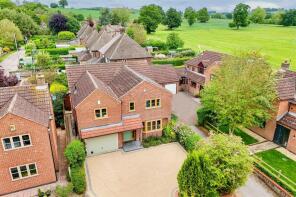
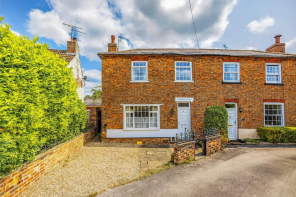
House Prices in NG25
House prices in NG25 have an overall average of £422,494 over the last year.
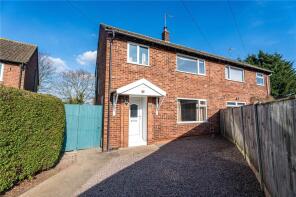
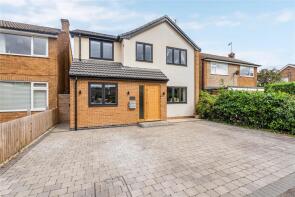
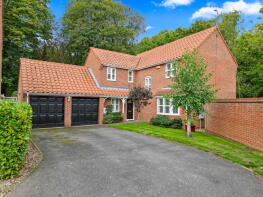
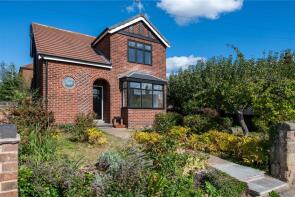
The majority of properties sold in NG25 during the last year were detached properties, selling for an average price of £528,329. Semi-detached properties sold for an average of £329,503, with terraced properties fetching £235,496.
Overall, the historical sold prices in NG25 over the last year were 3% up on the previous year and 2% down on the 2023 peak of £431,028.
Properties Sold
Deer Leap, Oxton Hill, Southwell NG25 0RB
| Today | See what it's worth now |
| 17 Apr 2026 | £835,000 |
No other historical records.
Archways, Station Road, Southwell NG25 0UG
| Today | See what it's worth now |
| 17 Apr 2026 | £575,000 |
| 27 Aug 2015 | £380,000 |
47, Hopewell Rise, Southwell NG25 0NX
| Today | See what it's worth now |
| 17 Apr 2026 | £75,000 |
| 24 Jan 2025 | £70,000 |
No other historical records.
Extensions and planning permission in NG25
See planning approval stats, extension build costs and value added estimates.

21, Dudley Doy Road, Southwell NG25 0NJ
| Today | See what it's worth now |
| 8 Apr 2026 | £544,400 |
| 23 Jun 2020 | £450,000 |
3, Handford Court, Southwell NG25 0HH
| Today | See what it's worth now |
| 7 Apr 2026 | £292,500 |
| 31 Jan 2006 | £200,000 |
No other historical records.
3, Dover Street, Southwell NG25 0EZ
| Today | See what it's worth now |
| 2 Apr 2026 | £325,000 |
| 5 May 1998 | £69,000 |
2, California Cottages, Main Street, Southwell NG25 0UN
| Today | See what it's worth now |
| 2 Apr 2026 | £187,500 |
| 14 May 2021 | £155,000 |
22, Silvey Avenue, Southwell NG25 0BU
| Today | See what it's worth now |
| 31 Mar 2026 | £238,000 |
| 29 Apr 2008 | £176,950 |
No other historical records.
5, Bramley Close, Southwell NG25 0JB
| Today | See what it's worth now |
| 30 Mar 2026 | £270,000 |
| 15 Jun 2021 | £245,000 |
4, Woodland Drive, Southwell NG25 0DA
| Today | See what it's worth now |
| 27 Mar 2026 | £435,000 |
| 6 Aug 2021 | £282,500 |
No other historical records.
11, Byron Gardens, Southwell NG25 0DW
| Today | See what it's worth now |
| 27 Mar 2026 | £363,000 |
| 26 Mar 2021 | £320,000 |
31, Hopewell Rise, Southwell NG25 0NX
| Today | See what it's worth now |
| 27 Mar 2026 | £400,000 |
| 26 Mar 2021 | £349,000 |
No other historical records.
Lampards, Gravelly Lane, Southwell NG25 0UW
| Today | See what it's worth now |
| 25 Mar 2026 | £485,000 |
| 6 Aug 2015 | £309,950 |
No other historical records.
8, Honing Drive, Southwell NG25 0LB
| Today | See what it's worth now |
| 25 Mar 2026 | £310,000 |
| 29 Jan 1998 | £79,000 |
No other historical records.
67e Kingfisher Cottage, Church Street, Southwell NG25 0HQ
| Today | See what it's worth now |
| 24 Mar 2026 | £882,500 |
| 18 Sep 2017 | £547,500 |
13, Arnold Avenue, Southwell NG25 0BP
| Today | See what it's worth now |
| 20 Mar 2026 | £265,000 |
| 15 Apr 2005 | £151,000 |
10, Wolsey Close, Southwell NG25 0AZ

| Today | See what it's worth now |
| 20 Mar 2026 | £179,500 |
| 14 Mar 2014 | £163,000 |
2, Orchard Court, Southwell NG25 0SR
| Today | See what it's worth now |
| 12 Mar 2026 | £470,000 |
| 2 Sep 2016 | £340,000 |
49, Fiskerton Road, Southwell NG25 0TH
| Today | See what it's worth now |
| 27 Feb 2026 | £225,000 |
| 14 Sep 2007 | £185,000 |
Vine Cottage, Station Road, Southwell NG25 0UG
| Today | See what it's worth now |
| 25 Feb 2026 | £440,000 |
| 27 Apr 2021 | £400,000 |
17, Landseer Road, Southwell NG25 0LX
| Today | See what it's worth now |
| 25 Feb 2026 | £235,000 |
| 31 Mar 2016 | £179,950 |
3, Cedar Green, Southwell NG25 0FJ
| Today | See what it's worth now |
| 20 Feb 2026 | £670,000 |
| 8 Apr 2010 | £450,000 |
4, Palace View, Southwell NG25 0HR
| Today | See what it's worth now |
| 20 Feb 2026 | £319,950 |
| 25 Jul 2022 | £300,000 |
No other historical records.
Source Acknowledgement: © Crown copyright. England and Wales house price data is publicly available information produced by the HM Land Registry.This material was last updated on 9 July 2026. It covers the period from 1 January 1995 to 30 April 2026 and contains property transactions which have been registered during that period. Contains HM Land Registry data © Crown copyright and database right 2026. This data is licensed under the Open Government Licence v3.0.
Disclaimer: Rightmove.co.uk provides this HM Land Registry data "as is". The burden for fitness of the data relies completely with the user and is provided for informational purposes only. No warranty, express or implied, is given relating to the accuracy of content of the HM Land Registry data and Rightmove does not accept any liability for error or omission. If you have found an error with the data or need further information please contact HM Land Registry.
Permitted Use: Viewers of this Information are granted permission to access this Crown copyright material and to download it onto electronic, magnetic, optical or similar storage media provided that such activities are for private research, study or in-house use only. Any other use of the material requires the formal written permission of Land Registry which can be requested from us, and is subject to an additional licence and associated charge.
Rightmove takes no liability for your use of, or reliance on, Rightmove's Instant Valuation due to the limitations of our tracking tool listed here. Use of this tool is taken entirely at your own risk. All rights reserved.