
House Prices in Otterham Quay
House prices in Otterham Quay have an overall average of £348,581 over the last year.
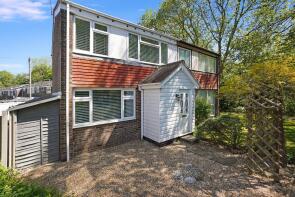
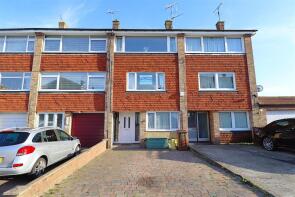
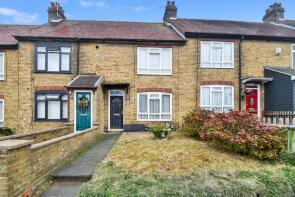
The majority of properties sold in Otterham Quay during the last year were terraced properties, selling for an average price of £306,834. Semi-detached properties sold for an average of £370,180, with detached properties fetching £458,114.
Overall, the historical sold prices in Otterham Quay over the last year were 2% down on the previous year and 1% down on the 2022 peak of £352,363.
Properties Sold
45, Ellison Way, Rainham, Gillingham ME8 7PG
| Today | See what it's worth now |
| 25 Mar 2026 | £312,500 |
| 24 May 2021 | £277,000 |
156, Scott Avenue, Rainham, Gillingham ME8 8EH
| Today | See what it's worth now |
| 25 Mar 2026 | £310,000 |
| 3 Aug 2017 | £240,000 |
13, Warlingham Close, Rainham, Gillingham ME8 7QJ
| Today | See what it's worth now |
| 23 Mar 2026 | £325,000 |
| 20 Nov 2020 | £250,000 |
64, Nightingale Close, Rainham, Gillingham ME8 8HR
| Today | See what it's worth now |
| 19 Mar 2026 | £318,000 |
| 31 Aug 2023 | £325,000 |
Flat 5, 231 Axford Court, High Street, Rainham, Gillingham ME8 8AY
| Today | See what it's worth now |
| 18 Mar 2026 | £173,000 |
| 19 Oct 2018 | £125,000 |
10, Chilton Court, Rainham, Gillingham ME8 7DH
| Today | See what it's worth now |
| 18 Mar 2026 | £400,000 |
No other historical records.
40, Laurel Walk, Rainham, Gillingham ME8 8HU
| Today | See what it's worth now |
| 13 Mar 2026 | £250,000 |
| 15 Feb 2013 | £139,500 |
55, Parkfield Road, Rainham, Gillingham ME8 7TA
| Today | See what it's worth now |
| 11 Mar 2026 | £380,000 |
| 5 Feb 2004 | £185,000 |
No other historical records.
6, Cherry Orchard Drive, Rainham, Gillingham ME8 8GD
| Today | See what it's worth now |
| 6 Mar 2026 | £330,000 |
| 30 Jun 2022 | £330,000 |
No other historical records.
Flat 1, Morello House, Pomeroy Avenue, Rainham, Gillingham ME8 7FN
| Today | See what it's worth now |
| 6 Mar 2026 | £84,000 |
No other historical records.
784, Meresborough Road, Rainham, Gillingham ME8 8SP
| Today | See what it's worth now |
| 6 Mar 2026 | £302,000 |
| 31 Mar 2012 | £155,000 |
82, Beverley Close, Rainham, Gillingham ME8 9HQ
| Today | See what it's worth now |
| 27 Feb 2026 | £322,500 |
| 4 Jan 2000 | £66,000 |
No other historical records.
10, Quinnell Street, Rainham, Gillingham ME8 7JW
| Today | See what it's worth now |
| 27 Feb 2026 | £245,000 |
No other historical records.
109, Pump Lane, Rainham, Gillingham ME8 7AL
| Today | See what it's worth now |
| 26 Feb 2026 | £461,500 |
| 19 Dec 2018 | £380,000 |
41, Wakeley Road, Rainham, Gillingham ME8 8HD
| Today | See what it's worth now |
| 25 Feb 2026 | £500,000 |
| 7 Feb 1997 | £105,000 |
No other historical records.
8, Ivy Street, Rainham, Gillingham ME8 8BE
| Today | See what it's worth now |
| 24 Feb 2026 | £315,000 |
| 17 Dec 2021 | £280,000 |
22, Broomcroft Road, Rainham, Gillingham ME8 7NS
| Today | See what it's worth now |
| 24 Feb 2026 | £390,000 |
| 15 Jun 2007 | £235,500 |
14, Middleton Close, Parkwood, Gillingham ME8 9LR
| Today | See what it's worth now |
| 20 Feb 2026 | £195,000 |
| 16 Feb 2001 | £58,500 |
3, Bail Close, Rainham, Gillingham ME8 7FF
| Today | See what it's worth now |
| 19 Feb 2026 | £415,000 |
| 25 Jul 2022 | £419,000 |
No other historical records.
8, Berengrave Lane, Rainham, Gillingham ME8 7LS
| Today | See what it's worth now |
| 11 Feb 2026 | £585,000 |
| 22 Feb 2008 | £390,000 |
58, Moor Park Close, Rainham, Gillingham ME8 8QT
| Today | See what it's worth now |
| 10 Feb 2026 | £358,000 |
| 16 Sep 2010 | £180,000 |
29, Bedson Walk, Rainham, Gillingham ME8 8NN
| Today | See what it's worth now |
| 6 Feb 2026 | £322,500 |
| 20 Sep 2019 | £240,000 |
No other historical records.
9, Mierscourt Close, Rainham, Gillingham ME8 8JD
| Today | See what it's worth now |
| 6 Feb 2026 | £376,000 |
| 21 Jun 2024 | £280,000 |
Source Acknowledgement: © Crown copyright. England and Wales house price data is publicly available information produced by the HM Land Registry.This material was last updated on 15 May 2026. It covers the period from 1 January 1995 to 31 March 2026 and contains property transactions which have been registered during that period. Contains HM Land Registry data © Crown copyright and database right 2026. This data is licensed under the Open Government Licence v3.0.
Disclaimer: Rightmove.co.uk provides this HM Land Registry data "as is". The burden for fitness of the data relies completely with the user and is provided for informational purposes only. No warranty, express or implied, is given relating to the accuracy of content of the HM Land Registry data and Rightmove does not accept any liability for error or omission. If you have found an error with the data or need further information please contact HM Land Registry.
Permitted Use: Viewers of this Information are granted permission to access this Crown copyright material and to download it onto electronic, magnetic, optical or similar storage media provided that such activities are for private research, study or in-house use only. Any other use of the material requires the formal written permission of Land Registry which can be requested from us, and is subject to an additional licence and associated charge.
Rightmove takes no liability for your use of, or reliance on, Rightmove's Instant Valuation due to the limitations of our tracking tool listed here. Use of this tool is taken entirely at your own risk. All rights reserved.