
House Prices in Redmarley
House prices in Redmarley have an overall average of £536,667 over the last year.
Overall, the historical sold prices in Redmarley over the last year were 21% down on the previous year and 21% down on the 2023 peak of £676,000.
Properties Sold
Pear Tree Cottage, The Causeway, Gloucester GL19 3JS

| Today | See today's value |
| 1 Jul 2026 | £615,000 |
| 31 Oct 2017 | £345,000 |
Larksmere, Road From The Causeway To Junction With The Lottery, Gloucester GL19 3HS

| Today | See today's value |
| 9 Mar 2026 | £465,000 |
| 10 Jul 2007 | £425,000 |
Drury Lane Cottage, Drury Lane, Gloucester GL19 3JX

| Today | See today's value |
| 20 Oct 2025 | £530,000 |
| 11 Dec 2002 | £210,000 |
No other historical records.
3 Hyde Park Croft, Covent Garden, Gloucester GL19 3LH
| Today | See today's value |
| 25 Sep 2025 | £890,000 |
| 3 Feb 2021 | £697,000 |
No other historical records.
Mellow Farm Lodge, Hawcross, Gloucester GL19 3JQ

| Today | See today's value |
| 19 Sep 2025 | £365,000 |
| 14 Jun 2019 | £405,000 |
No other historical records.
Barn Cottage, May Farm, Pendock Road, Redmarley GL19 3LG

| Today | See today's value |
| 7 Aug 2025 | £690,000 |
| 21 Oct 2016 | £295,000 |
Coniston Cottage, Road From The Causeway To Junction With The Lottery, Gloucester GL19 3HS

| Today | See today's value |
| 19 Jun 2025 | £370,000 |
| 4 Nov 2022 | £390,000 |
No other historical records.
6 Richmond Barn, Covent Garden, Gloucester GL19 3LH

| Today | See today's value |
| 14 Apr 2025 | £875,000 |
| 18 Dec 2019 | £710,000 |
No other historical records.
Martindale, The Green, Gloucester GL19 3JT

| Today | See today's value |
| 26 Mar 2025 | £785,000 |
| 23 Nov 2010 | £415,000 |
No other historical records.
8 Grosvenor Lodge, Covent Garden, Gloucester GL19 3LH
| Today | See today's value |
| 17 Feb 2025 | £755,000 |
| 11 Nov 2020 | £594,950 |
No other historical records.
Sheffy Oak Farm, Drury Lane, Gloucester GL19 3JX

| Today | See today's value |
| 15 Oct 2024 | £910,000 |
| 19 Apr 2004 | £430,000 |
No other historical records.
Hillview Farm, Forty Green, Lowbands, Redmarley GL19 3SL
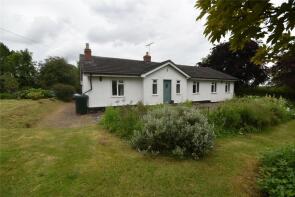
| Today | See today's value |
| 2 Oct 2024 | £454,000 |
No other historical records.
1d, Rock Meadow, Redmarley GL19 3FA
| Today | See today's value |
| 30 Aug 2024 | £475,000 |
No other historical records.
Avonhurst, Road Unofficially Known As Brand Green Road, Brand Green, Gloucester GL19 3JD

| Today | See today's value |
| 11 Jul 2024 | £785,000 |
| 2 Dec 2015 | £547,950 |
Leadon Lodge, Road From Verwood To Junction With Brand Green Road, Pauntley, Gloucester GL19 3HZ

| Today | See today's value |
| 2 Jul 2024 | £665,000 |
No other historical records.
Wayside, Road From Junction With Ledbury Road To Pendock Road, Park Gate, Gloucester GL19 3NH

| Today | See today's value |
| 9 May 2024 | £650,000 |
| 22 Mar 2001 | £190,000 |
No other historical records.
2, Hyde Park Corner, Gloucester GL19 3JR
| Today | See today's value |
| 1 Mar 2024 | £255,000 |
| 13 Apr 2017 | £233,000 |
No other historical records.
Smithy Cottage, The Causeway, Gloucester GL19 3JP

| Today | See today's value |
| 18 Jan 2024 | £138,000 |
| 20 Oct 2009 | £380,000 |
No other historical records.
2, The Vines, Gloucester GL19 3FG
| Today | See today's value |
| 8 Dec 2023 | £376,500 |
| 21 Dec 2020 | £294,995 |
No other historical records.
Folly Field, Durbridge Road, Gloucester GL19 3LP

| Today | See today's value |
| 31 Oct 2023 | £785,000 |
| 12 Nov 2015 | £510,000 |
No other historical records.
Lowbands Barn, Chartist Lane, Lowbands, Gloucester GL19 3NL

| Today | See today's value |
| 17 Oct 2023 | £740,000 |
No other historical records.
Orchard House, Drury Lane, Gloucester GL19 3JX
| Today | See today's value |
| 25 Aug 2023 | £1,675,000 |
| 9 Sep 2003 | £562,500 |
No other historical records.
Woodbine Cottage, Forty Green, Lowbands, Gloucester GL19 3SL
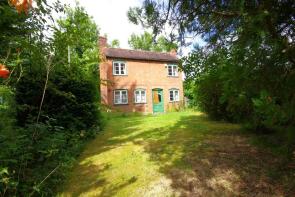
| Today | See today's value |
| 14 Jul 2023 | £330,000 |
No other historical records.


Rightmove takes no liability for your use of, or reliance on, Rightmove's Instant Valuation due to the limitations of our tracking tool listed here. Use of this tool is taken entirely at your own risk. All rights reserved.