
House Prices in S73
House prices in S73 have an overall average of £178,635 over the last year.
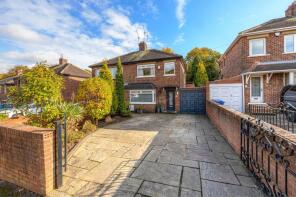
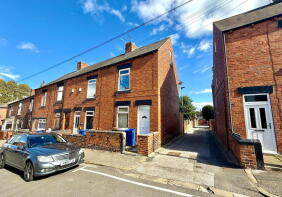
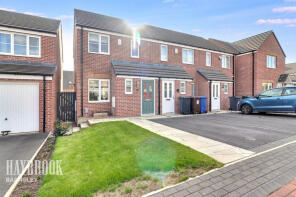
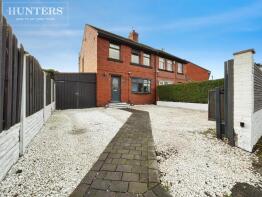
The majority of properties sold in S73 during the last year were semi-detached properties, selling for an average price of £174,838. Terraced properties sold for an average of £140,767, with detached properties fetching £277,805.
Overall, the historical sold prices in S73 over the last year were 5% down on the previous year and 3% up on the 2023 peak of £173,624.
Properties Sold
3, Barnsley Road, Darfield, Barnsley S73 9PA
| Today | See what it's worth now |
| 13 Apr 2026 | £92,000 |
| 13 Aug 2024 | £85,000 |
7, Springfield Crescent, Darfield, Barnsley S73 9NJ
| Today | See what it's worth now |
| 10 Apr 2026 | £192,000 |
| 29 Nov 2024 | £175,000 |
9, Garden Grove, Hemingfield, Barnsley S73 0PR
| Today | See what it's worth now |
| 7 Apr 2026 | £88,000 |
| 28 Apr 1995 | £15,000 |
No other historical records.
Extensions and planning permission in S73
See planning approval stats, extension build costs and value added estimates.

1, Coronation Terrace, Hemingfield Road, Hemingfield, Barnsley S73 0PY
| Today | See what it's worth now |
| 7 Apr 2026 | £105,000 |
| 5 Aug 2022 | £105,000 |
48, Rose Grove, Wombwell, Barnsley S73 8ND

| Today | See what it's worth now |
| 2 Apr 2026 | £202,500 |
No other historical records.
31, Bramham Croft, Darfield, Barnsley S73 8BE
| Today | See what it's worth now |
| 31 Mar 2026 | £150,000 |
| 4 May 2007 | £129,950 |
10, Little Stubbing, Wombwell, Barnsley S73 8FG
| Today | See what it's worth now |
| 27 Mar 2026 | £195,000 |
| 14 Mar 2008 | £164,950 |
No other historical records.
31, Frederick Street, Wombwell, Barnsley S73 8JY
| Today | See what it's worth now |
| 27 Mar 2026 | £80,000 |
| 24 May 2021 | £70,000 |
49, Barnsley Road, Darfield, Barnsley S73 9PB
| Today | See what it's worth now |
| 27 Mar 2026 | £185,000 |
| 12 Feb 2021 | £137,500 |
10, Dovecote, Wombwell, Barnsley S73 0LS
| Today | See what it's worth now |
| 27 Mar 2026 | £195,000 |
| 3 Jun 2016 | £130,000 |
12, Myrtle Road, Wombwell, Barnsley S73 8LN
| Today | See what it's worth now |
| 27 Mar 2026 | £93,000 |
| 5 Jun 2020 | £68,000 |
10, Pashley Croft, Wombwell, Barnsley S73 0LD
| Today | See what it's worth now |
| 20 Mar 2026 | £260,000 |
| 2 May 2003 | £135,000 |
23, Bartholomew Street, Wombwell, Barnsley S73 8LF
| Today | See what it's worth now |
| 20 Mar 2026 | £167,000 |
| 1 Apr 2005 | £84,000 |
12, Eastwell Grove, Wombwell, Barnsley S73 0NZ
| Today | See what it's worth now |
| 13 Mar 2026 | £125,000 |
| 18 Aug 2015 | £96,000 |
15, Broomhead Road, Wombwell, Barnsley S73 0SA

| Today | See what it's worth now |
| 6 Mar 2026 | £173,000 |
| 1 Jul 2003 | £55,000 |
No other historical records.
9, Saffron Court, Wombwell, Barnsley S73 0AP
| Today | See what it's worth now |
| 6 Mar 2026 | £216,000 |
| 9 Jun 2006 | £170,500 |
No other historical records.
59, Wood Walk, Wombwell, Barnsley S73 0NB
| Today | See what it's worth now |
| 6 Mar 2026 | £255,000 |
No other historical records.
13, John Street, Wombwell, Barnsley S73 8LW
| Today | See what it's worth now |
| 3 Mar 2026 | £90,000 |
| 12 May 2005 | £59,000 |
10, Lundhill Crescent, Wombwell, Barnsley S73 0WJ
| Today | See what it's worth now |
| 2 Mar 2026 | £175,000 |
| 30 Nov 2020 | £140,000 |
No other historical records.
22, Windmill Road, Wombwell, Barnsley S73 8PH
| Today | See what it's worth now |
| 27 Feb 2026 | £95,000 |
No other historical records.
3, Burrows Grove, Wombwell, Barnsley S73 8PT
| Today | See what it's worth now |
| 27 Feb 2026 | £182,000 |
| 9 Aug 2019 | £95,000 |
No other historical records.
55, West Avenue, Wombwell, Barnsley S73 8QG
| Today | See what it's worth now |
| 27 Feb 2026 | £150,000 |
No other historical records.
Riverton, Fitzwilliam Road, Darfield, Barnsley S73 9HY
| Today | See what it's worth now |
| 27 Feb 2026 | £750,000 |
No other historical records.

Source Acknowledgement: © Crown copyright. England and Wales house price data is publicly available information produced by the HM Land Registry.This material was last updated on 9 July 2026. It covers the period from 1 January 1995 to 30 April 2026 and contains property transactions which have been registered during that period. Contains HM Land Registry data © Crown copyright and database right 2026. This data is licensed under the Open Government Licence v3.0.
Disclaimer: Rightmove.co.uk provides this HM Land Registry data "as is". The burden for fitness of the data relies completely with the user and is provided for informational purposes only. No warranty, express or implied, is given relating to the accuracy of content of the HM Land Registry data and Rightmove does not accept any liability for error or omission. If you have found an error with the data or need further information please contact HM Land Registry.
Permitted Use: Viewers of this Information are granted permission to access this Crown copyright material and to download it onto electronic, magnetic, optical or similar storage media provided that such activities are for private research, study or in-house use only. Any other use of the material requires the formal written permission of Land Registry which can be requested from us, and is subject to an additional licence and associated charge.
Rightmove takes no liability for your use of, or reliance on, Rightmove's Instant Valuation due to the limitations of our tracking tool listed here. Use of this tool is taken entirely at your own risk. All rights reserved.