House Prices in SA42
House prices in SA42 have an overall average of £434,467 over the last year.
The majority of properties sold in SA42 during the last year were detached properties, selling for an average price of £493,167. Terraced properties sold for an average of £348,000, with semi-detached properties fetching £490,000.
Overall, the historical sold prices in SA42 over the last year were 6% up on the previous year and 13% down on the 2022 peak of £497,606.
Properties Sold
Rhoslan, Feidr Fawr, Newport SA42 0SA

| Today | See today's value |
| 12 Aug 2026 | £275,000 |
| 16 Oct 2019 | £215,000 |
12, Maes Morfa, Newport SA42 0TR

| Today | See today's value |
| 28 Jul 2026 | £195,000 |
| 3 Dec 2007 | £150,000 |
No other historical records.
3, Swn Y Nant, Newport SA42 0PF

| Today | See today's value |
| 26 Jun 2026 | £545,000 |
| 4 Feb 2022 | £500,000 |
No other historical records.
Y Tyddyn, Fishguard Road, Newport SA42 0UB

| Today | See today's value |
| 24 Mar 2026 | £360,000 |
| 17 Feb 2020 | £320,000 |
No other historical records.
Mill Cottage, Feidr Felin, Newport SA42 0PN
| Today | See today's value |
| 23 Mar 2026 | £762,500 |
No other historical records.
11, Parc Yr Eglwys, Brynhenllan, Newport SA42 0SH

| Today | See today's value |
| 12 Mar 2026 | £336,500 |
| 26 Aug 2015 | £222,500 |
No other historical records.
Myrtles, Upper St Mary Street, Newport SA42 0PS
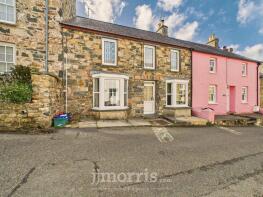
| Today | See today's value |
| 27 Feb 2026 | £360,000 |
No other historical records.
Myrtwydd, A487 Dinas To Junction Fedir Brenin, Newport SA42 0UR

| Today | See today's value |
| 25 Feb 2026 | £345,000 |
| 25 Mar 2019 | £179,500 |
Dwyfor, Bay View, Dinas Cross SA42 0UP

| Today | See today's value |
| 20 Feb 2026 | £353,000 |
| 4 Sep 2015 | £250,000 |
42, Maes Ingli, Newport SA42 0TE

| Today | See today's value |
| 9 Feb 2026 | £250,000 |
| 19 Nov 2002 | £78,000 |
6, Will Phillips Yard, West Street, Newport SA42 0TW

| Today | See today's value |
| 18 Dec 2025 | £375,000 |
| 16 May 2017 | £287,800 |
No other historical records.
Bronwydd, Upper St Mary Street, Newport SA42 0PS
| Today | See today's value |
| 15 Dec 2025 | £555,000 |
| 25 Jan 2007 | £104,000 |
No other historical records.
Parc Y Nant, Parrog Road, Newport SA42 0RJ

| Today | See today's value |
| 4 Dec 2025 | £695,000 |
| 12 Feb 1999 | £75,000 |
No other historical records.
2 Ysbrydoliaeth, Gerddi Windsor, Newport SA42 0RL
| Today | See today's value |
| 27 Oct 2025 | £415,000 |
| 19 Dec 2003 | £57,500 |
West Field, C3089 Junction Parrog Road, Parrog, Newport SA42 0RP
| Today | See today's value |
| 3 Oct 2025 | £695,000 |
No other historical records.
Brynhenllan Cottage, C3163 Junction U3146 To Brynhellan, Brynhenllan, Newport SA42 0SD

| Today | See today's value |
| 26 Sep 2025 | £277,500 |
| 5 Oct 2017 | £225,000 |
5, Spencer Buildings, A487 Dinas To Junction Fedir Brenin, Newport SA42 0UW
| Today | See today's value |
| 24 Sep 2025 | £360,000 |
| 6 Feb 1998 | £35,000 |
No other historical records.
Bryn Ingli, A487 Newport To Temple Bar Junction B4582, Newport SA42 0LZ

| Today | See today's value |
| 29 Aug 2025 | £640,000 |
| 29 Nov 2013 | £470,000 |
3, Springhill Terrace, Parrog Road, Newport SA42 0RJ
| Today | See today's value |
| 8 Aug 2025 | £375,000 |
No other historical records.
Brynywawr, Upper St Mary Street, Newport SA42 0PS
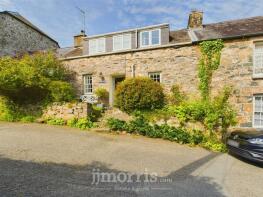
| Today | See today's value |
| 19 Jun 2025 | £325,000 |
| 6 Oct 2011 | £220,000 |
No other historical records.
Trefasser, Upper St Mary Street, Newport SA42 0PS

| Today | See today's value |
| 2 Jun 2025 | £484,000 |
| 24 Aug 2015 | £305,000 |
No other historical records.
Ffynnon Wen, U3148 Brynhellan Village To Dinas Country Club, Newport SA42 0UN

| Today | See today's value |
| 16 May 2025 | £450,000 |
| 17 Dec 2020 | £387,500 |
2, Feidr Eglwys, Newport SA42 0QA
| Today | See today's value |
| 16 May 2025 | £330,000 |
| 17 Apr 1997 | £54,950 |
No other historical records.


Rightmove takes no liability for your use of, or reliance on, Rightmove's Instant Valuation due to the limitations of our tracking tool listed here. Use of this tool is taken entirely at your own risk. All rights reserved.