
House Prices in SE18 6YR
House prices in SE18 6YR have an overall average of £463,000 over the last year.
Overall, the historical sold prices in SE18 6YR over the last year were 8% up on the previous year and 1% up on the 2022 peak of £457,500.
Properties Sold
Flat 278, Building 22, Cadogan Road, London SE18 6YR

| Today | See what it's worth now |
| 14 Mar 2025 | £419,000 |
| 26 Jun 2017 | £447,500 |
Flat 384, Building 22, Cadogan Road, London SE18 6YR
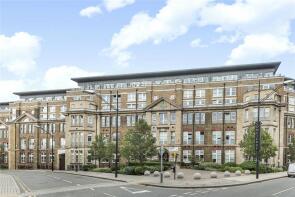
| Today | See what it's worth now |
| 21 Feb 2025 | £560,000 |
| 13 Sep 2007 | £390,000 |
No other historical records.
Flat 358, Building 22, Cadogan Road, London SE18 6YR
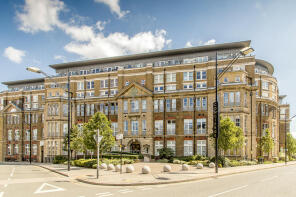
| Today | See what it's worth now |
| 14 Jan 2025 | £410,000 |
| 13 Sep 2007 | £310,000 |
No other historical records.
Extensions and planning permission in SE18
See planning approval stats, extension build costs and value added estimates.


Flat 346, Building 22, Cadogan Road, London SE18 6YR
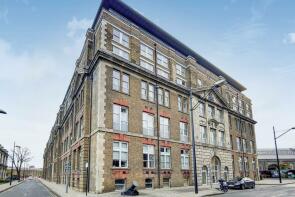
| Today | See what it's worth now |
| 17 Sep 2024 | £387,500 |
| 30 Mar 2016 | £381,000 |
Flat 292, Building 22, Cadogan Road, London SE18 6YR
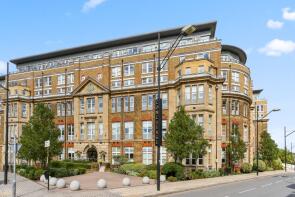
| Today | See what it's worth now |
| 6 Sep 2024 | £175,000 |
| 19 Jul 2021 | £105,000 |
Flat 386, Building 22, Cadogan Road, London SE18 6YR

| Today | See what it's worth now |
| 30 Aug 2024 | £578,875 |
| 2 Sep 2016 | £575,000 |
Flat 316, Building 22, Cadogan Road, London SE18 6YR
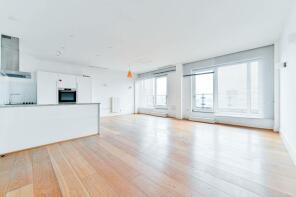
| Today | See what it's worth now |
| 12 Jul 2024 | £570,000 |
| 2 Dec 2014 | £597,500 |
Flat 334, Building 22, Cadogan Road, London SE18 6YR
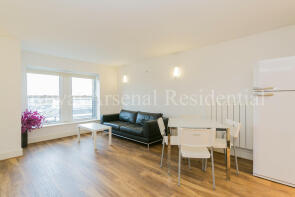
| Today | See what it's worth now |
| 31 May 2024 | £315,000 |
| 22 Nov 2006 | £230,000 |
No other historical records.
Flat 390, Building 22, Cadogan Road, London SE18 6YR

| Today | See what it's worth now |
| 28 May 2024 | £538,000 |
| 12 Sep 2007 | £405,000 |
No other historical records.
Flat 408, Building 22, Cadogan Road, London SE18 6YR
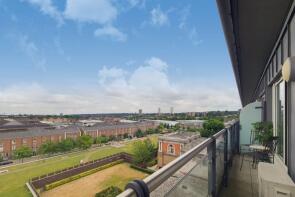
| Today | See what it's worth now |
| 18 Oct 2022 | £530,000 |
| 27 Nov 2006 | £385,000 |
No other historical records.
Flat 350, Building 22, Cadogan Road, London SE18 6YR

| Today | See what it's worth now |
| 19 Aug 2022 | £390,000 |
| 12 Sep 2007 | £290,000 |
No other historical records.
Flat 280, Building 22, Cadogan Road, London SE18 6YR

| Today | See what it's worth now |
| 14 Jul 2022 | £370,000 |
| 8 Oct 2007 | £320,000 |
No other historical records.
Flat 398, Building 22, Cadogan Road, London SE18 6YR

| Today | See what it's worth now |
| 18 Feb 2022 | £540,000 |
| 1 Aug 2016 | £526,000 |
Flat 360, Building 22, Cadogan Road, London SE18 6YR

| Today | See what it's worth now |
| 18 Oct 2021 | £400,000 |
| 17 Sep 2007 | £300,000 |
No other historical records.
Flat 308, Building 22, Cadogan Road, London SE18 6YR
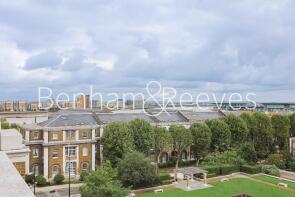
| Today | See what it's worth now |
| 3 Sep 2021 | £333,000 |
| 14 Mar 2013 | £230,500 |
Flat 306, Building 22, Cadogan Road, London SE18 6YR

| Today | See what it's worth now |
| 30 Mar 2021 | £417,500 |
| 7 Dec 2015 | £390,000 |
Flat 372, Building 22, Cadogan Road, London SE18 6YR
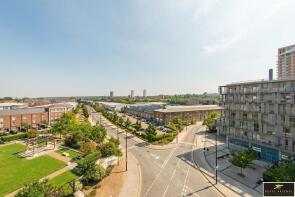
| Today | See what it's worth now |
| 19 Mar 2021 | £315,000 |
| 30 Sep 2016 | £310,000 |
Flat 286, Building 22, Cadogan Road, London SE18 6YR
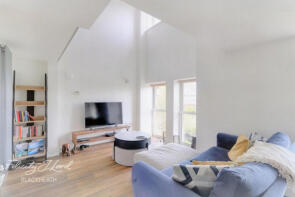
| Today | See what it's worth now |
| 5 Mar 2021 | £430,000 |
| 27 May 2016 | £440,000 |
Flat 296, Building 22, Cadogan Road, London SE18 6YR
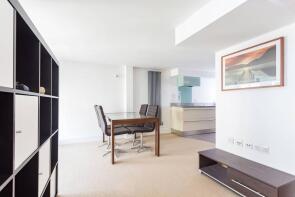
| Today | See what it's worth now |
| 5 Mar 2021 | £395,000 |
| 18 Sep 2007 | £218,856 |
No other historical records.
Flat 364, Building 22, Cadogan Road, London SE18 6YR
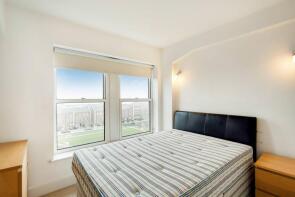
| Today | See what it's worth now |
| 5 Feb 2021 | £449,999 |
No other historical records.
Flat 294, Building 22, Cadogan Road, London SE18 6YR

| Today | See what it's worth now |
| 23 Nov 2018 | £465,000 |
| 16 Mar 2012 | £249,999 |
Flat 310, Building 22, Cadogan Road, London SE18 6YR

| Today | See what it's worth now |
| 25 May 2018 | £310,000 |
| 7 Dec 2006 | £160,000 |
No other historical records.
Flat 404, Building 22, Cadogan Road, London SE18 6YR
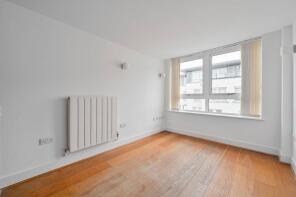
| Today | See what it's worth now |
| 20 Apr 2015 | £246,000 |
| 27 Jun 2007 | £195,000 |
No other historical records.
Flat 362, Building 22, Cadogan Road, London SE18 6YR
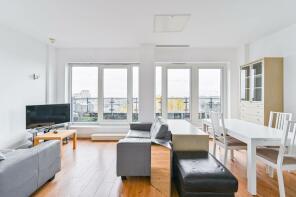
| Today | See what it's worth now |
| 9 Jan 2015 | £440,000 |
| 19 Sep 2007 | £365,000 |
No other historical records.
Flat 326, Building 22, Cadogan Road, London SE18 6YR
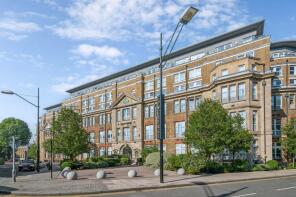
| Today | See what it's worth now |
| 5 Jan 2015 | £329,000 |
| 3 Jul 2007 | £315,000 |
No other historical records.
Source Acknowledgement: © Crown copyright. England and Wales house price data is publicly available information produced by the HM Land Registry.This material was last updated on 2 December 2025. It covers the period from 1 January 1995 to 31 October 2025 and contains property transactions which have been registered during that period. Contains HM Land Registry data © Crown copyright and database right 2026. This data is licensed under the Open Government Licence v3.0.
Disclaimer: Rightmove.co.uk provides this HM Land Registry data "as is". The burden for fitness of the data relies completely with the user and is provided for informational purposes only. No warranty, express or implied, is given relating to the accuracy of content of the HM Land Registry data and Rightmove does not accept any liability for error or omission. If you have found an error with the data or need further information please contact HM Land Registry.
Permitted Use: Viewers of this Information are granted permission to access this Crown copyright material and to download it onto electronic, magnetic, optical or similar storage media provided that such activities are for private research, study or in-house use only. Any other use of the material requires the formal written permission of Land Registry which can be requested from us, and is subject to an additional licence and associated charge.
Map data ©OpenStreetMap contributors.
Rightmove takes no liability for your use of, or reliance on, Rightmove's Instant Valuation due to the limitations of our tracking tool listed here. Use of this tool is taken entirely at your own risk. All rights reserved.


