
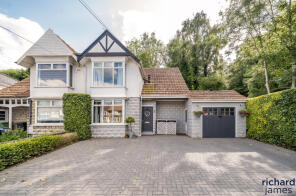
House Prices in Marlborough Road, Swindon, SN3
House prices in Marlborough Road have an overall average of £299,567 over the last year.
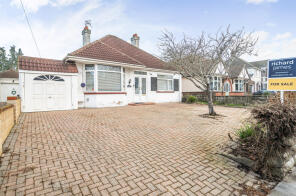
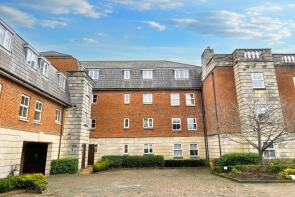
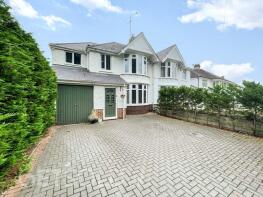
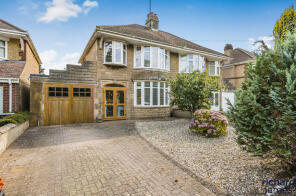
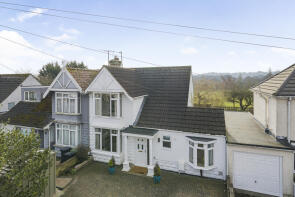
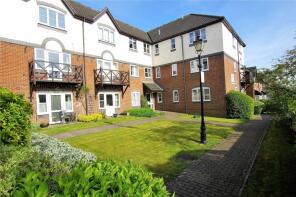
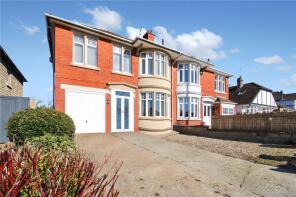
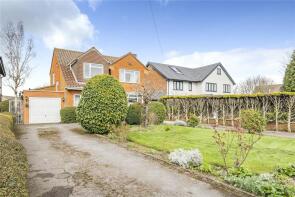
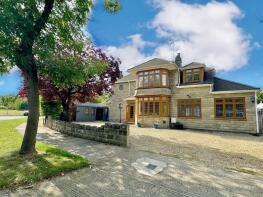
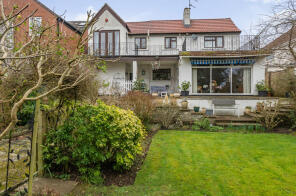
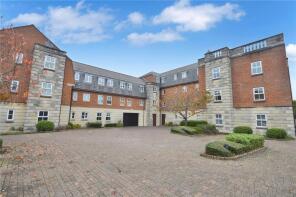
The majority of properties sold in Marlborough Road during the last year were semi-detached properties, selling for an average price of £451,500. Flats sold for an average of £154,100, with detached properties fetching £325,000.
Overall, the historical sold prices in Marlborough Road over the last year were 9% down on the previous year and 31% down on the 2018 peak of £434,750.
Properties Sold
5, Henrietta Court, Marlborough Road, Swindon SN3 1QJ
| Today | See what it's worth now |
| 20 Feb 2026 | £149,000 |
| 25 Apr 2014 | £129,350 |
4, The Acorns, Marlborough Road, Swindon SN3 1PG
| Today | See what it's worth now |
| 5 Dec 2025 | £170,000 |
| 3 Nov 2022 | £185,000 |
15, Henrietta Court, Marlborough Road, Swindon SN3 1QJ
| Today | See what it's worth now |
| 14 Nov 2025 | £155,000 |
| 2 Nov 2018 | £150,000 |
Extensions and planning permission in SN3
See planning approval stats, extension build costs and value added estimates.

49, Marlborough Road, Swindon SN3 1PJ
| Today | See what it's worth now |
| 5 Nov 2025 | £450,000 |
| 13 Jul 2012 | £249,500 |
24, Marlborough Road, Swindon SN3 1QY

| Today | See what it's worth now |
| 10 Oct 2025 | £241,800 |
| 4 Dec 2020 | £193,500 |
137, Marlborough Road, Swindon SN3 1NJ
| Today | See what it's worth now |
| 29 Sep 2025 | £325,000 |
No other historical records.
15, Ashlar Court, Marlborough Road, Swindon SN3 1QW
| Today | See what it's worth now |
| 12 Sep 2025 | £171,500 |
| 13 Jul 2018 | £170,000 |
55, Marlborough Road, Swindon SN3 1PJ
| Today | See what it's worth now |
| 12 Sep 2025 | £452,500 |
| 26 Mar 2021 | £415,000 |
83, Marlborough Road, Swindon SN3 1PL
| Today | See what it's worth now |
| 9 Sep 2025 | £450,000 |
| 29 Sep 2021 | £395,000 |
302, Marlborough Road, Swindon SN3 1NP
| Today | See what it's worth now |
| 25 Jul 2025 | £425,000 |
| 6 Jan 2022 | £385,000 |
216, Marlborough Road, Swindon SN3 1NX
| Today | See what it's worth now |
| 30 Jun 2025 | £480,000 |
| 18 Aug 2023 | £490,000 |
18, Henrietta Court, Marlborough Road, Swindon SN3 1QJ
| Today | See what it's worth now |
| 27 Jun 2025 | £125,000 |
| 9 May 2014 | £122,500 |
121, Marlborough Road, Swindon SN3 1NJ
| Today | See what it's worth now |
| 30 May 2025 | £425,000 |
No other historical records.
163, Marlborough Road, Swindon SN3 1NJ

| Today | See what it's worth now |
| 29 May 2025 | £560,000 |
| 13 Oct 2017 | £455,000 |
11, Ashlar Court, Marlborough Road, Swindon SN3 1QW

| Today | See what it's worth now |
| 25 Apr 2025 | £185,000 |
| 11 Oct 2019 | £163,000 |
247, Marlborough Road, Swindon SN3 1NN
| Today | See what it's worth now |
| 31 Mar 2025 | £520,000 |
| 12 May 1997 | £150,000 |
No other historical records.
97 Pooh Corner, Marlborough Road, Swindon SN3 1PL
| Today | See what it's worth now |
| 27 Mar 2025 | £626,000 |
| 2 Nov 2018 | £530,000 |
Oasis Of Peace, Marlborough Road, Swindon SN3 1NP
| Today | See what it's worth now |
| 26 Mar 2025 | £497,500 |
No other historical records.
4, Ashlar Court, Marlborough Road, Swindon SN3 1QW
| Today | See what it's worth now |
| 21 Mar 2025 | £215,000 |
| 7 Dec 2001 | £230,000 |
No other historical records.
150, Marlborough Road, Swindon SN3 1LU
| Today | See what it's worth now |
| 17 Mar 2025 | £390,000 |
| 9 Nov 2018 | £307,000 |
394, Marlborough Road, Swindon SN3 1NP
| Today | See what it's worth now |
| 28 Feb 2025 | £495,500 |
| 25 Jan 2013 | £227,000 |
No other historical records.
9, Henrietta Court, Marlborough Road, Swindon SN3 1QJ
| Today | See what it's worth now |
| 24 Jan 2025 | £126,500 |
No other historical records.
16, Henrietta Court, Marlborough Road, Swindon SN3 1QJ
| Today | See what it's worth now |
| 8 Jan 2025 | £120,000 |
No other historical records.

Source Acknowledgement: © Crown copyright. England and Wales house price data is publicly available information produced by the HM Land Registry.This material was last updated on 15 May 2026. It covers the period from 1 January 1995 to 31 March 2026 and contains property transactions which have been registered during that period. Contains HM Land Registry data © Crown copyright and database right 2026. This data is licensed under the Open Government Licence v3.0.
Disclaimer: Rightmove.co.uk provides this HM Land Registry data "as is". The burden for fitness of the data relies completely with the user and is provided for informational purposes only. No warranty, express or implied, is given relating to the accuracy of content of the HM Land Registry data and Rightmove does not accept any liability for error or omission. If you have found an error with the data or need further information please contact HM Land Registry.
Permitted Use: Viewers of this Information are granted permission to access this Crown copyright material and to download it onto electronic, magnetic, optical or similar storage media provided that such activities are for private research, study or in-house use only. Any other use of the material requires the formal written permission of Land Registry which can be requested from us, and is subject to an additional licence and associated charge.
Map data ©OpenStreetMap contributors.
Rightmove takes no liability for your use of, or reliance on, Rightmove's Instant Valuation due to the limitations of our tracking tool listed here. Use of this tool is taken entirely at your own risk. All rights reserved.