
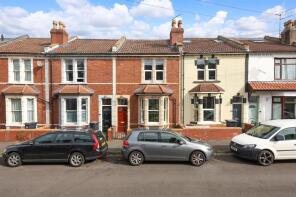
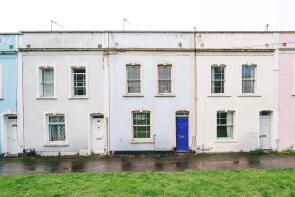
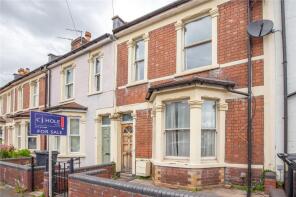
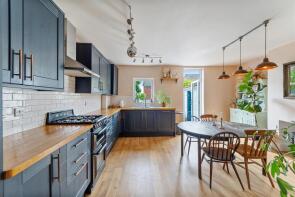
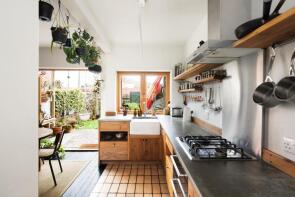
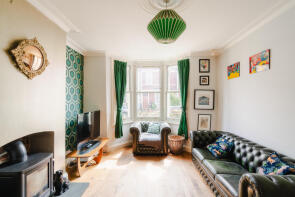
House Prices in St. Werburghs
House prices in St. Werburghs have an overall average of £431,293 over the last year.
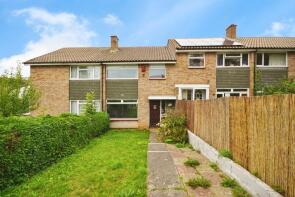
The majority of properties sold in St. Werburghs during the last year were terraced properties, selling for an average price of £451,730. Flats sold for an average of £210,833, with semi-detached properties fetching £435,000.
Overall, the historical sold prices in St. Werburghs over the last year were 7% up on the previous year and similar to the 2022 peak of £433,924.
Properties Sold
8, Warminster Road, St Werburghs, Bristol BS2 9UH
| Today | See what it's worth now |
| 22 Apr 2026 | £410,000 |
| 21 Aug 2024 | £410,000 |
23, Lynmouth Road, St Werburghs, Bristol BS2 9YH
| Today | See what it's worth now |
| 17 Apr 2026 | £491,000 |
| 18 Dec 2014 | £278,000 |
8, Lynmouth Road, St Werburghs, Bristol BS2 9YH
| Today | See what it's worth now |
| 31 Mar 2026 | £450,000 |
| 13 Jul 2022 | £365,000 |
No other historical records.
10, Southey Street, St Werburghs, Bristol BS2 9RE

| Today | See what it's worth now |
| 19 Mar 2026 | £535,000 |
| 19 Apr 2021 | £490,000 |
No other historical records.
14, Penfield Road, St Werburghs, Bristol BS2 9YG
| Today | See what it's worth now |
| 17 Mar 2026 | £350,000 |
No other historical records.
6, Horley Road, St Werburghs, Bristol BS2 9TJ
| Today | See what it's worth now |
| 13 Mar 2026 | £459,500 |
| 19 Sep 2019 | £340,000 |
14, Mina Park Crescent, St Werburghs, Bristol BS2 9AJ
| Today | See what it's worth now |
| 13 Mar 2026 | £585,000 |
| 22 Jul 2022 | £580,000 |
No other historical records.
20, Hereford Road, St Werburghs, Bristol BS2 9UW
| Today | See what it's worth now |
| 12 Mar 2026 | £420,000 |
| 16 Jul 2019 | £355,000 |
23, Conduit Road, St Werburghs, Bristol BS2 9RW
| Today | See what it's worth now |
| 12 Mar 2026 | £450,000 |
| 6 Aug 2020 | £345,000 |
30d, Sussex Place, St Werburghs, Bristol BS2 9QW

| Today | See what it's worth now |
| 9 Mar 2026 | £195,000 |
No other historical records.
30, Sevier Street, St Werburghs, Bristol BS2 9QS
| Today | See what it's worth now |
| 13 Feb 2026 | £314,000 |
| 24 Mar 2016 | £227,000 |
No other historical records.
16, The Yard, St Werburghs, Bristol BS2 9YR
| Today | See what it's worth now |
| 13 Feb 2026 | £510,000 |
| 28 Aug 2007 | £275,000 |
No other historical records.
35, Horley Road, St Werburghs, Bristol BS2 9TL
| Today | See what it's worth now |
| 13 Feb 2026 | £336,000 |
| 23 Aug 2001 | £92,000 |
No other historical records.
52, Stafford Road, St Werburghs, Bristol BS2 9UN

| Today | See what it's worth now |
| 6 Feb 2026 | £470,000 |
| 30 Jan 2015 | £205,000 |
No other historical records.
40, Southey Street, St Werburghs, Bristol BS2 9RE
| Today | See what it's worth now |
| 9 Jan 2026 | £340,000 |
| 26 Aug 2004 | £147,000 |
26, Sevier Street, St Werburghs, Bristol BS2 9QS
| Today | See what it's worth now |
| 5 Jan 2026 | £360,000 |
| 28 Apr 2017 | £274,000 |
42, Mina Road, St Werburghs, Bristol BS2 9XH
| Today | See what it's worth now |
| 19 Dec 2025 | £380,000 |
| 2 Sep 2015 | £280,000 |
No other historical records.
1, Mary Carpenter Place, St Werburghs, Bristol BS2 9RX
| Today | See what it's worth now |
| 18 Dec 2025 | £130,500 |
No other historical records.
58, St Werburghs Road, St Werburghs, Bristol BS2 9XX
| Today | See what it's worth now |
| 15 Dec 2025 | £400,000 |
No other historical records.
64, St Werburghs Park, St Werburghs, Bristol BS2 9YU
| Today | See what it's worth now |
| 9 Dec 2025 | £460,000 |
| 20 Mar 2023 | £446,000 |
24, Stafford Road, St Werburghs, Bristol BS2 9UN
| Today | See what it's worth now |
| 28 Nov 2025 | £515,000 |
| 15 Oct 2018 | £282,500 |
No other historical records.
23, Southey Street, St Werburghs, Bristol BS2 9RE

| Today | See what it's worth now |
| 21 Nov 2025 | £500,000 |
| 21 Mar 2019 | £355,000 |
17, Sandbed Road, St Werburghs, Bristol BS2 9TY
| Today | See what it's worth now |
| 12 Nov 2025 | £365,000 |
| 20 Dec 2013 | £240,000 |


Source Acknowledgement: © Crown copyright. England and Wales house price data is publicly available information produced by the HM Land Registry.This material was last updated on 9 July 2026. It covers the period from 1 January 1995 to 30 April 2026 and contains property transactions which have been registered during that period. Contains HM Land Registry data © Crown copyright and database right 2026. This data is licensed under the Open Government Licence v3.0.
Disclaimer: Rightmove.co.uk provides this HM Land Registry data "as is". The burden for fitness of the data relies completely with the user and is provided for informational purposes only. No warranty, express or implied, is given relating to the accuracy of content of the HM Land Registry data and Rightmove does not accept any liability for error or omission. If you have found an error with the data or need further information please contact HM Land Registry.
Permitted Use: Viewers of this Information are granted permission to access this Crown copyright material and to download it onto electronic, magnetic, optical or similar storage media provided that such activities are for private research, study or in-house use only. Any other use of the material requires the formal written permission of Land Registry which can be requested from us, and is subject to an additional licence and associated charge.
Rightmove takes no liability for your use of, or reliance on, Rightmove's Instant Valuation due to the limitations of our tracking tool listed here. Use of this tool is taken entirely at your own risk. All rights reserved.