House Prices in TQ1
House prices in TQ1 have an overall average of £256,705 over the last year.
The majority of properties sold in TQ1 during the last year were flats, selling for an average price of £162,537. Terraced properties sold for an average of £229,923, with detached properties fetching £566,914.
Overall, the historical sold prices in TQ1 over the last year were 2% down on the previous year and 14% down on the 2023 peak of £297,927.
Properties Sold
76, Victoria Park Road, St Marychurch, Torquay TQ1 3QJ

| Today | See today's value |
| 24 Aug 2026 | £130,000 |
| 28 Jul 2004 | £120,000 |
No other historical records.
115, Lymington Road, Torquay TQ1 4BG
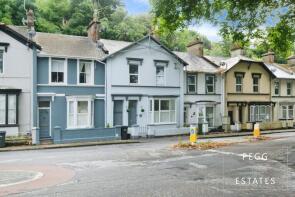
| Today | See today's value |
| 18 Aug 2026 | £195,000 |
| 17 Dec 2021 | £188,875 |
124b, Westhill Road, St Marychurch, Torquay TQ1 4NT
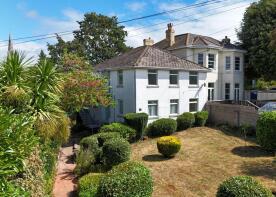
| Today | See today's value |
| 18 Aug 2026 | £200,000 |
| 20 Dec 2013 | £130,000 |
Extensions and planning permission in TQ1
See planning approval stats, extension build costs and value added estimates.

Flat 15, Willis Court, Shirburn Road, Torquay TQ1 4JN
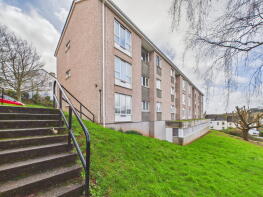
| Today | See today's value |
| 18 Aug 2026 | £95,000 |
| 28 Feb 1997 | £32,950 |
No other historical records.
53, Dunmere Road, Torquay TQ1 1LR
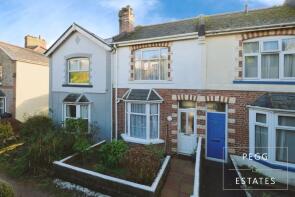
| Today | See today's value |
| 17 Aug 2026 | £162,000 |
| 8 May 2009 | £99,000 |
No other historical records.
The Mount, St Marks Road, Wellswood, Torquay TQ1 2EH

| Today | See today's value |
| 17 Aug 2026 | £730,000 |
| 30 Oct 2000 | £250,000 |
No other historical records.
Flat 2, Courtenay Manor, Grafton Road, Wellswood, Torquay TQ1 1UN
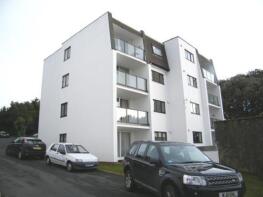
| Today | See today's value |
| 17 Aug 2026 | £150,000 |
| 9 Nov 1998 | £46,000 |
No other historical records.
1, Derwent Road, Torquay TQ1 3QL
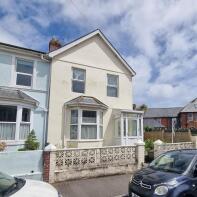
| Today | See today's value |
| 14 Aug 2026 | £125,000 |
| 1 Dec 2009 | £143,000 |
No other historical records.
8, Cary Park Road, Torquay TQ1 3PU
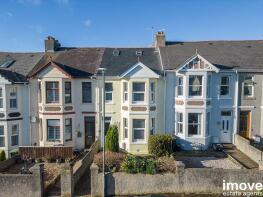
| Today | See today's value |
| 10 Aug 2026 | £333,000 |
| 25 Oct 2007 | £215,000 |
Flat 10, Courtenay Manor, Grafton Road, Wellswood, Torquay TQ1 1UN

| Today | See today's value |
| 10 Aug 2026 | £185,000 |
| 15 Mar 2018 | £113,000 |
No other historical records.
56, Hartop Road, St Marychurch, Torquay TQ1 4QQ
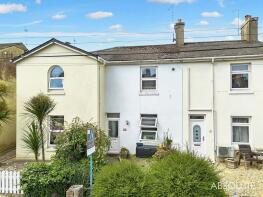
| Today | See today's value |
| 10 Aug 2026 | £205,000 |
| 26 Jul 2019 | £148,000 |
22, Colwyn Court, Asheldon Road, Wellswood, Torquay TQ1 2QT
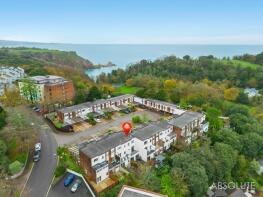
| Today | See today's value |
| 7 Aug 2026 | £300,000 |
| 7 Jun 2019 | £225,000 |
12, Springfield Road, St Marychurch, Torquay TQ1 3QA
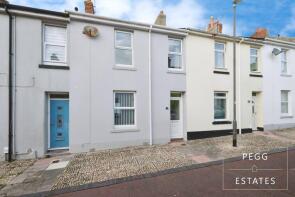
| Today | See today's value |
| 6 Aug 2026 | £215,000 |
No other historical records.
159, Windsor Road, Torquay TQ1 1SR
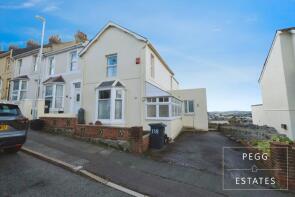
| Today | See today's value |
| 6 Aug 2026 | £310,000 |
No other historical records.
Flat 10, Stanley Court, Stanley Road, St Marychurch, Torquay TQ1 3JJ
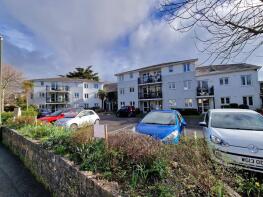
| Today | See today's value |
| 6 Aug 2026 | £162,000 |
| 7 Nov 2003 | £151,450 |
No other historical records.
Flat, 5a, St James Place, St Marychurch, Torquay TQ1 3UY

| Today | See today's value |
| 31 Jul 2026 | £125,000 |
| 17 Aug 2018 | £108,000 |
No other historical records.
8b, St James Road, Torquay TQ1 4AZ

| Today | See today's value |
| 31 Jul 2026 | £110,000 |
| 30 Jul 2021 | £90,000 |
18, Daison Crescent, St Marychurch, Torquay TQ1 4LJ
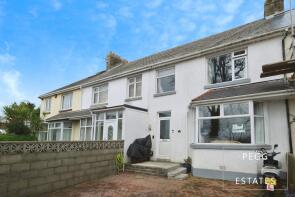
| Today | See today's value |
| 30 Jul 2026 | £230,000 |
| 25 Jun 2021 | £191,000 |
No other historical records.
1, The Palms, Lower Warberry Road, Torquay TQ1 1TS
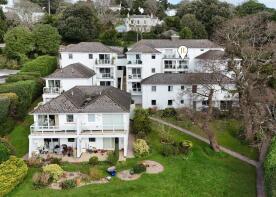
| Today | See today's value |
| 30 Jul 2026 | £221,000 |
| 11 Dec 2012 | £167,500 |
37, Perinville Road, Torquay TQ1 3NZ
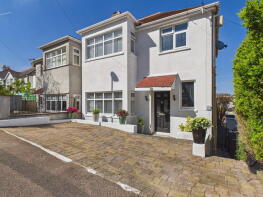
| Today | See today's value |
| 29 Jul 2026 | £345,000 |
| 2 Dec 2005 | £160,000 |
No other historical records.
25, Lower Shirburn Road, Torquay TQ1 3ET
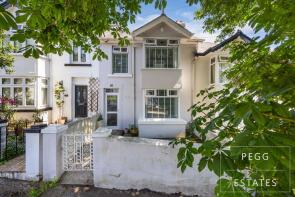
| Today | See today's value |
| 29 Jul 2026 | £260,000 |
| 8 Dec 2017 | £173,000 |
Flat 3, Watcombe Court, Watcombe Beach Road, Torquay TQ1 4SH
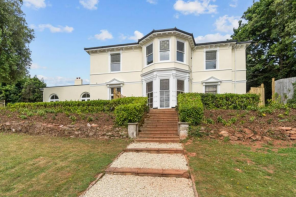
| Today | See today's value |
| 29 Jul 2026 | £235,000 |
No other historical records.
19, Haytor Road, St Marychurch, Torquay TQ1 4LP
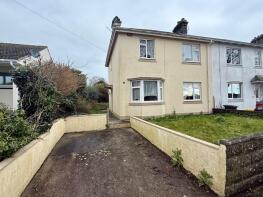
| Today | See today's value |
| 27 Jul 2026 | £215,000 |
No other historical records.
Rightmove takes no liability for your use of, or reliance on, Rightmove's Instant Valuation due to the limitations of our tracking tool listed here. Use of this tool is taken entirely at your own risk. All rights reserved.