
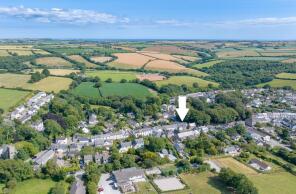
House Prices in TR2
House prices in TR2 have an overall average of £537,432 over the last year.
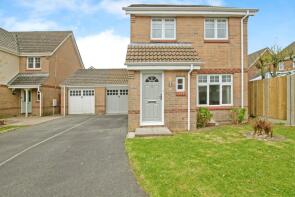
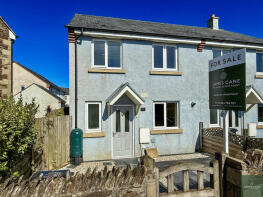
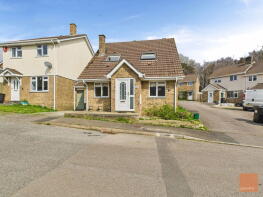
The majority of properties sold in TR2 during the last year were detached properties, selling for an average price of £750,181. Terraced properties sold for an average of £359,119, with semi-detached properties fetching £379,309.
Overall, the historical sold prices in TR2 over the last year were 5% up on the previous year and 5% up on the 2022 peak of £510,214.
Properties Sold
25, Bosnoweth, Truro TR2 4HE
| Today | See what it's worth now |
| 27 Mar 2026 | £325,000 |
| 30 Nov 2012 | £225,000 |
Culham, The Square, Truro TR2 4LG
| Today | See what it's worth now |
| 27 Mar 2026 | £387,000 |
| 30 Nov 2018 | £295,000 |
No other historical records.
7, Rose Hill, Truro TR2 4PR

| Today | See what it's worth now |
| 20 Mar 2026 | £205,000 |
| 20 Feb 2015 | £149,000 |
No other historical records.
Extensions and planning permission in TR2
See planning approval stats, extension build costs and value added estimates.

10, St Austell Road, Truro TR2 4LF
| Today | See what it's worth now |
| 10 Mar 2026 | £250,000 |
| 30 Jun 2014 | £173,000 |
Vercoe, Fore Street, Truro TR2 4RS
| Today | See what it's worth now |
| 6 Mar 2026 | £292,000 |
| 11 Apr 2023 | £255,000 |
No other historical records.
1, Hawthorne Cottage, Fore Street, Truro TR2 4RR
| Today | See what it's worth now |
| 6 Mar 2026 | £193,000 |
| 20 Jul 2018 | £145,000 |
3 Nansawsan Cottage, Nansawsan Terrace, Road From The A39 At Bissick House To Corbiere, Truro TR2 4PQ
| Today | See what it's worth now |
| 6 Mar 2026 | £312,000 |
| 7 Apr 2017 | £200,000 |
Pernickety, Fore Street, Truro TR2 4LY
| Today | See what it's worth now |
| 6 Mar 2026 | £415,000 |
| 19 Mar 2004 | £285,000 |
No other historical records.
The Anchorage, Top Hill, Truro TR2 4TP
| Today | See what it's worth now |
| 2 Mar 2026 | £270,000 |
| 30 Oct 2006 | £200,000 |
4, Parc An Dowr Gardens, Parcandowr, Truro TR2 4FT
| Today | See what it's worth now |
| 2 Mar 2026 | £270,000 |
| 27 Sep 2019 | £191,000 |
No other historical records.
East House, Station Road, Truro TR2 4EE
| Today | See what it's worth now |
| 27 Feb 2026 | £385,000 |
| 28 Sep 2021 | £370,000 |
The Old Forge, Road From Penhalligans To White Lane, Truro TR2 5NB
| Today | See what it's worth now |
| 27 Feb 2026 | £480,000 |
| 27 Oct 2017 | £320,000 |
Penbetha House, Grampound TR2 4RX
| Today | See what it's worth now |
| 24 Feb 2026 | £665,330 |
| 4 Jun 2018 | £480,000 |
Rosehill Cottage, Rose Hill, Ladock TR2 4PQ
| Today | See what it's worth now |
| 24 Feb 2026 | £387,500 |
| 20 Jul 2006 | £278,000 |
No other historical records.
26, Fore Street, Tregony TR2 5RN
| Today | See what it's worth now |
| 23 Feb 2026 | £200,000 |
No other historical records.
33, Carne View Road, Truro TR2 4HZ
| Today | See what it's worth now |
| 2 Feb 2026 | £268,000 |
| 19 Feb 2007 | £205,000 |
28, Lewman Road, Truro TR2 4LL
| Today | See what it's worth now |
| 30 Jan 2026 | £323,000 |
| 25 Oct 2010 | £215,000 |
Manderville, Wagg Lane, Probus TR2 4JX
| Today | See what it's worth now |
| 30 Jan 2026 | £410,000 |
No other historical records.
16, Bosnoweth, Truro TR2 4HE
| Today | See what it's worth now |
| 22 Jan 2026 | £430,000 |
| 30 Sep 2022 | £455,000 |
90, Carne View Road, Truro TR2 4TR
| Today | See what it's worth now |
| 22 Jan 2026 | £305,000 |
| 28 Aug 2014 | £192,000 |
7, Old Tannery Lane, Truro TR2 4PZ

| Today | See what it's worth now |
| 21 Jan 2026 | £460,000 |
| 23 Dec 2015 | £360,000 |
30, Gwell An Nans, Truro TR2 4ND
| Today | See what it's worth now |
| 16 Jan 2026 | £450,000 |
| 19 Aug 2016 | £257,000 |
15, Creekside View, Tresillian TR2 4BS
| Today | See what it's worth now |
| 15 Jan 2026 | £322,500 |
No other historical records.
Source Acknowledgement: © Crown copyright. England and Wales house price data is publicly available information produced by the HM Land Registry.This material was last updated on 9 July 2026. It covers the period from 1 January 1995 to 30 April 2026 and contains property transactions which have been registered during that period. Contains HM Land Registry data © Crown copyright and database right 2026. This data is licensed under the Open Government Licence v3.0.
Disclaimer: Rightmove.co.uk provides this HM Land Registry data "as is". The burden for fitness of the data relies completely with the user and is provided for informational purposes only. No warranty, express or implied, is given relating to the accuracy of content of the HM Land Registry data and Rightmove does not accept any liability for error or omission. If you have found an error with the data or need further information please contact HM Land Registry.
Permitted Use: Viewers of this Information are granted permission to access this Crown copyright material and to download it onto electronic, magnetic, optical or similar storage media provided that such activities are for private research, study or in-house use only. Any other use of the material requires the formal written permission of Land Registry which can be requested from us, and is subject to an additional licence and associated charge.
Rightmove takes no liability for your use of, or reliance on, Rightmove's Instant Valuation due to the limitations of our tracking tool listed here. Use of this tool is taken entirely at your own risk. All rights reserved.