
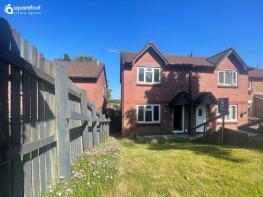
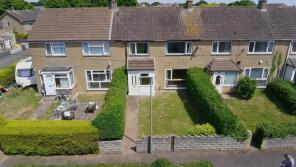
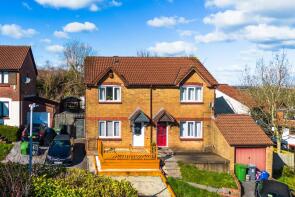
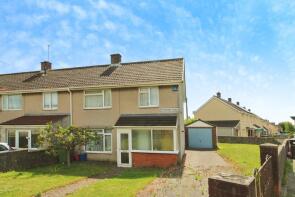
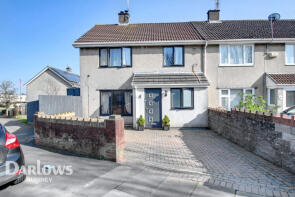
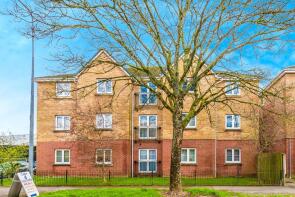
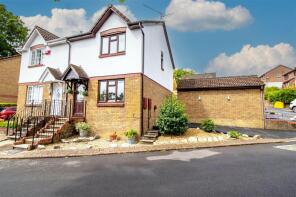
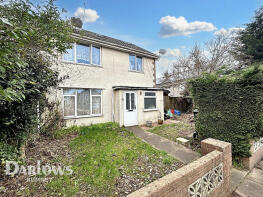
House Prices in Tredelerch
House prices in Tredelerch have an overall average of £225,060 over the last year.
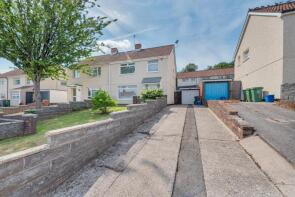
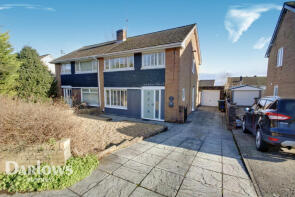
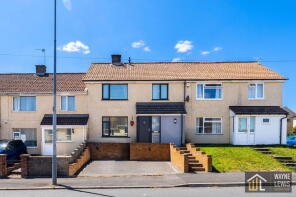
The majority of properties sold in Tredelerch during the last year were terraced properties, selling for an average price of £203,909. Semi-detached properties sold for an average of £245,600, with detached properties fetching £332,500.
Overall, the historical sold prices in Tredelerch over the last year were 7% up on the previous year and 12% up on the 2023 peak of £200,091.
Properties Sold
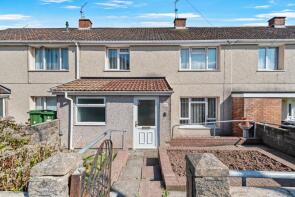
74, Aberdaron Road, Trowbridge, Cardiff CF3 1SF
| Today | See what it's worth now |
| 16 Apr 2026 | £181,000 |
No other historical records.
78, Brynbala Way, Trowbridge, Cardiff CF3 1SZ
| Today | See what it's worth now |
| 20 Mar 2026 | £230,000 |
| 29 Oct 2014 | £120,000 |
35, Harris Avenue, Rumney, Cardiff CF3 1QA
| Today | See what it's worth now |
| 6 Feb 2026 | £245,000 |
| 14 Dec 2015 | £126,000 |
55, Meadvale Road, Rumney, Cardiff CF3 1UG
| Today | See what it's worth now |
| 30 Jan 2026 | £300,000 |
| 11 Dec 2020 | £240,000 |
No other historical records.
45, Aberdaron Road, Trowbridge, Cardiff CF3 1SF
| Today | See what it's worth now |
| 16 Jan 2026 | £132,500 |
| 29 Apr 2019 | £104,000 |
72, Aberdaron Road, Trowbridge, Cardiff CF3 1SF
| Today | See what it's worth now |
| 19 Dec 2025 | £225,000 |
No other historical records.
53, Aberdaron Road, Trowbridge, Cardiff CF3 1SF

| Today | See what it's worth now |
| 18 Dec 2025 | £255,000 |
| 26 Jul 2021 | £195,000 |
No other historical records.
14, Dovey Close, Trowbridge, Cardiff CF3 1RJ
| Today | See what it's worth now |
| 10 Dec 2025 | £251,000 |
| 12 Jan 2018 | £157,000 |
No other historical records.
396, Greenway Road, Trowbridge, Cardiff CF3 1QS
| Today | See what it's worth now |
| 9 Dec 2025 | £245,000 |
| 23 Jan 2015 | £165,000 |
270, Greenway Road, Rumney, Cardiff CF3 3PL

| Today | See what it's worth now |
| 1 Dec 2025 | £227,500 |
| 4 Oct 2019 | £170,000 |
74, Hendre Road, Trowbridge, Cardiff CF3 1QX
| Today | See what it's worth now |
| 21 Nov 2025 | £219,500 |
| 17 Aug 2007 | £118,500 |
1, Duncan Close, Rumney, Cardiff CF3 1NP
| Today | See what it's worth now |
| 24 Oct 2025 | £240,000 |
| 11 Jan 2019 | £182,500 |
No other historical records.
52, Greenmeadows, Trowbridge, Cardiff CF3 1TG
| Today | See what it's worth now |
| 19 Sep 2025 | £215,000 |
| 11 Feb 2022 | £156,000 |
No other historical records.
11, Meadvale Road, Rumney, Cardiff CF3 1UF
| Today | See what it's worth now |
| 12 Sep 2025 | £365,000 |
| 25 Mar 2019 | £262,000 |
7, Trecinon Road, Trowbridge, Cardiff CF3 1TE

| Today | See what it's worth now |
| 12 Sep 2025 | £175,000 |
No other historical records.
23, Duncan Close, Rumney, Cardiff CF3 1NP
| Today | See what it's worth now |
| 26 Aug 2025 | £245,000 |
| 10 Jun 2016 | £148,000 |
2, Tresigin Road, Trowbridge, Cardiff CF3 1SJ
| Today | See what it's worth now |
| 13 Aug 2025 | £195,000 |
No other historical records.
8, Tresigin Road, Trowbridge, Cardiff CF3 1SJ
| Today | See what it's worth now |
| 11 Aug 2025 | £245,000 |
| 13 Jan 2017 | £130,000 |
No other historical records.
19, Trowbridge Road, Trowbridge, Cardiff CF3 1QJ

| Today | See what it's worth now |
| 8 Aug 2025 | £260,000 |
No other historical records.
80 Potters Mews, Greenway Road, Rumney, Cardiff CF3 3AY
| Today | See what it's worth now |
| 6 Aug 2025 | £130,000 |
| 20 Jul 2018 | £105,000 |
10, Duncan Close, Rumney, Cardiff CF3 1NP
| Today | See what it's worth now |
| 31 Jul 2025 | £265,000 |
| 15 Feb 2019 | £174,000 |
312, Greenway Road, Trowbridge, Cardiff CF3 1QR
| Today | See what it's worth now |
| 16 Jul 2025 | £220,000 |
| 1 Jul 1999 | £58,000 |
100, Trowbridge Green, Trowbridge, Cardiff CF3 1RB
| Today | See what it's worth now |
| 16 Jul 2025 | £185,000 |
| 29 Sep 2017 | £130,000 |
No other historical records.

Source Acknowledgement: © Crown copyright. England and Wales house price data is publicly available information produced by the HM Land Registry.This material was last updated on 9 July 2026. It covers the period from 1 January 1995 to 30 April 2026 and contains property transactions which have been registered during that period. Contains HM Land Registry data © Crown copyright and database right 2026. This data is licensed under the Open Government Licence v3.0.
Disclaimer: Rightmove.co.uk provides this HM Land Registry data "as is". The burden for fitness of the data relies completely with the user and is provided for informational purposes only. No warranty, express or implied, is given relating to the accuracy of content of the HM Land Registry data and Rightmove does not accept any liability for error or omission. If you have found an error with the data or need further information please contact HM Land Registry.
Permitted Use: Viewers of this Information are granted permission to access this Crown copyright material and to download it onto electronic, magnetic, optical or similar storage media provided that such activities are for private research, study or in-house use only. Any other use of the material requires the formal written permission of Land Registry which can be requested from us, and is subject to an additional licence and associated charge.
Rightmove takes no liability for your use of, or reliance on, Rightmove's Instant Valuation due to the limitations of our tracking tool listed here. Use of this tool is taken entirely at your own risk. All rights reserved.