
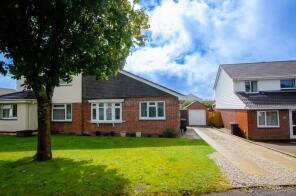
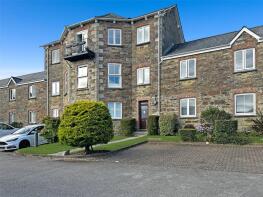
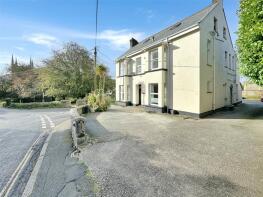
House Prices in Treswallock
House prices in Treswallock have an overall average of £288,774 over the last year.
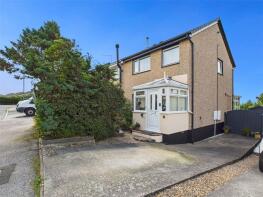
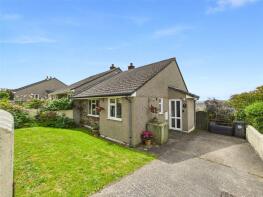
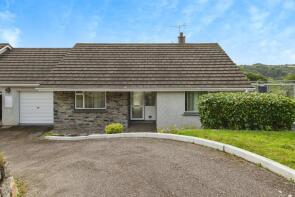
The majority of properties sold in Treswallock during the last year were detached properties, selling for an average price of £406,818. Semi-detached properties sold for an average of £224,497, with terraced properties fetching £206,775.
Overall, the historical sold prices in Treswallock over the last year were 10% down on the previous year and 17% down on the 2023 peak of £347,886.
Properties Sold
8, Wingfield, Bodmin PL31 2EZ
| Today | See what it's worth now |
| 27 Mar 2026 | £240,000 |
| 30 Jun 2021 | £215,000 |
23, Castle Hill Court, Cross Lane, Bodmin PL31 2LE
| Today | See what it's worth now |
| 27 Feb 2026 | £118,000 |
| 7 Aug 2020 | £82,000 |
18, Kernow Close, Bodmin PL31 2BX
| Today | See what it's worth now |
| 13 Feb 2026 | £245,000 |
| 11 Nov 1996 | £38,000 |
No other historical records.
19, Launceston Road, Bodmin PL31 2AL

| Today | See what it's worth now |
| 13 Feb 2026 | £310,000 |
| 16 Mar 2007 | £215,500 |
6, Chyryn Drive, St Breward, Bodmin PL30 4LL
| Today | See what it's worth now |
| 13 Feb 2026 | £215,000 |
| 24 Jun 2015 | £168,500 |
No other historical records.
35, Boxwell Park, Bodmin PL31 2BE
| Today | See what it's worth now |
| 9 Feb 2026 | £285,000 |
| 31 Aug 2006 | £230,000 |
21, Moor View, Bodmin PL31 1DG
| Today | See what it's worth now |
| 4 Feb 2026 | £227,500 |
| 31 Jul 2023 | £178,000 |
No other historical records.
The Forge, Road From Tregenna Road To Trewint Hill, Blisland, Bodmin PL30 4HX
| Today | See what it's worth now |
| 29 Jan 2026 | £710,000 |
| 20 Jul 2009 | £325,000 |
22, Celia Heights, Bodmin PL31 1EH
| Today | See what it's worth now |
| 16 Jan 2026 | £200,000 |
| 1 Dec 1999 | £53,000 |
No other historical records.
Tredeer, Coombe Mill, Road From Junction South East Of Tregarrick To Coombe Road, St Breward, Bodmin PL30 4LZ
| Today | See what it's worth now |
| 15 Jan 2026 | £550,000 |
No other historical records.
Valley View, Access To Valley View, Fletchersbridge, Bodmin PL30 4AN
| Today | See what it's worth now |
| 19 Dec 2025 | £430,000 |
| 9 Aug 2013 | £285,000 |
No other historical records.
62, Tanners Road, Bodmin PL31 2UW
| Today | See what it's worth now |
| 17 Dec 2025 | £185,000 |
| 26 Feb 2021 | £169,995 |
No other historical records.
62, Gilbert Road, Bodmin PL31 2BY
| Today | See what it's worth now |
| 16 Dec 2025 | £415,000 |
| 23 Nov 2023 | £450,000 |
24, Boxwell Park, Bodmin PL31 2BG
| Today | See what it's worth now |
| 15 Dec 2025 | £635,000 |
| 17 Jul 1998 | £157,000 |
No other historical records.
12, Priory Road, Bodmin PL31 2AG

| Today | See what it's worth now |
| 15 Dec 2025 | £260,000 |
| 1 Oct 1999 | £52,500 |
No other historical records.
Flat 4, 14, Castle Street, Bodmin PL31 2DU
| Today | See what it's worth now |
| 11 Dec 2025 | £100,000 |
| 30 Aug 2005 | £99,950 |
The Holme, Limehead, St Breward, Bodmin PL30 4LU
| Today | See what it's worth now |
| 5 Dec 2025 | £230,000 |
No other historical records.
20, Canyke Fields, Bodmin PL31 2FG
| Today | See what it's worth now |
| 28 Nov 2025 | £165,000 |
| 25 Jan 2019 | £145,000 |
78, Tanners Road, Bodmin PL31 2UW
| Today | See what it's worth now |
| 27 Nov 2025 | £298,000 |
No other historical records.
38, Celia Heights, Bodmin PL31 1EH
| Today | See what it's worth now |
| 27 Nov 2025 | £252,000 |
| 11 Aug 2006 | £135,000 |
No other historical records.
4, Canyke Fields, Bodmin PL31 2FG
| Today | See what it's worth now |
| 27 Nov 2025 | £340,000 |
| 11 May 2012 | £244,497 |
No other historical records.
Lower Rock Cottage, Limehead, Coombe Road, St Breward, Bodmin PL30 4DQ
| Today | See what it's worth now |
| 25 Nov 2025 | £190,000 |
No other historical records.
Churchtown Farm, Churchtown, St Breward PL30 4PP
| Today | See what it's worth now |
| 21 Nov 2025 | £290,000 |
| 14 Nov 2019 | £245,000 |
Source Acknowledgement: © Crown copyright. England and Wales house price data is publicly available information produced by the HM Land Registry.This material was last updated on 15 May 2026. It covers the period from 1 January 1995 to 31 March 2026 and contains property transactions which have been registered during that period. Contains HM Land Registry data © Crown copyright and database right 2026. This data is licensed under the Open Government Licence v3.0.
Disclaimer: Rightmove.co.uk provides this HM Land Registry data "as is". The burden for fitness of the data relies completely with the user and is provided for informational purposes only. No warranty, express or implied, is given relating to the accuracy of content of the HM Land Registry data and Rightmove does not accept any liability for error or omission. If you have found an error with the data or need further information please contact HM Land Registry.
Permitted Use: Viewers of this Information are granted permission to access this Crown copyright material and to download it onto electronic, magnetic, optical or similar storage media provided that such activities are for private research, study or in-house use only. Any other use of the material requires the formal written permission of Land Registry which can be requested from us, and is subject to an additional licence and associated charge.
Rightmove takes no liability for your use of, or reliance on, Rightmove's Instant Valuation due to the limitations of our tracking tool listed here. Use of this tool is taken entirely at your own risk. All rights reserved.