
House Prices in Turnberry Heights
House prices in Turnberry Heights have an overall average of £154,599 over the last year.
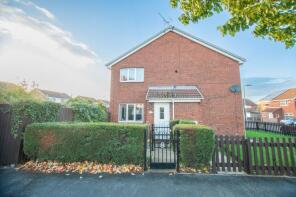
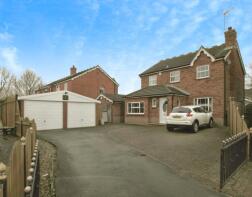
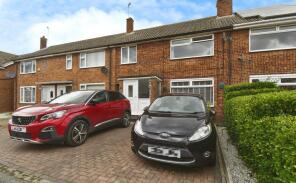
The majority of properties sold in Turnberry Heights during the last year were terraced properties, selling for an average price of £131,000. Semi-detached properties sold for an average of £156,159, with detached properties fetching £237,781.
Overall, the historical sold prices in Turnberry Heights over the last year were 4% down on the previous year and 4% down on the 2022 peak of £161,755.
Properties Sold
1053, Holderness Road, Hull HU8 9EG
| Today | See what it's worth now |
| 8 Apr 2026 | £118,500 |
| 29 Jun 2012 | £57,000 |
No other historical records.
202, Gleneagles Park, Hull HU8 9JU
| Today | See what it's worth now |
| 2 Apr 2026 | £122,000 |
| 7 Sep 2012 | £67,500 |
No other historical records.
8, Crowland Close, Hull HU8 9TP
| Today | See what it's worth now |
| 1 Apr 2026 | £117,000 |
| 19 May 2023 | £95,000 |
No other historical records.
88, Howdale Road, Hull HU8 9UU
| Today | See what it's worth now |
| 31 Mar 2026 | £279,000 |
| 13 Apr 2017 | £205,000 |
2, Rookley Close, Hull HU8 9QX
| Today | See what it's worth now |
| 25 Mar 2026 | £100,000 |
| 17 Jun 2016 | £70,000 |
No other historical records.
69, Waldegrave Avenue, Hull HU8 9BB

| Today | See what it's worth now |
| 20 Mar 2026 | £220,000 |
| 15 Dec 2017 | £160,000 |
43, Ellesmere Avenue, Hull HU8 9BS
| Today | See what it's worth now |
| 20 Mar 2026 | £211,000 |
| 16 Nov 2017 | £139,000 |
No other historical records.
133, Howdale Road, Hull HU8 9JY
| Today | See what it's worth now |
| 20 Mar 2026 | £152,000 |
| 6 Mar 2020 | £122,000 |
16, Astoria Crescent, Kingston Upon Hull HU8 9BJ
| Today | See what it's worth now |
| 20 Mar 2026 | £166,000 |
| 28 Mar 2025 | £80,000 |
No other historical records.
17, Waldegrave Avenue, Hull HU8 9BB
| Today | See what it's worth now |
| 20 Mar 2026 | £175,000 |
| 8 Nov 2007 | £115,000 |
No other historical records.
30, Ings Road, Hull HU8 0SA
| Today | See what it's worth now |
| 20 Mar 2026 | £257,000 |
| 9 Sep 2005 | £140,000 |
239, Waveney Road, Hull HU8 9NB
| Today | See what it's worth now |
| 19 Mar 2026 | £131,000 |
| 30 Apr 2004 | £46,500 |
No other historical records.
23, St Michaels Close, Hull HU8 9DY
| Today | See what it's worth now |
| 17 Mar 2026 | £150,000 |
| 7 Apr 2005 | £82,950 |
No other historical records.
4, Stannington Drive, Kingston Upon Hull HU8 9SP
| Today | See what it's worth now |
| 16 Mar 2026 | £115,000 |
No other historical records.
274, Howdale Road, Hull HU8 9TY
| Today | See what it's worth now |
| 6 Mar 2026 | £240,000 |
| 4 Sep 2024 | £235,000 |
14, Wisteria Way, Hull HU8 9WA
| Today | See what it's worth now |
| 6 Mar 2026 | £152,500 |
| 28 Oct 2016 | £103,500 |
22, Sutton Court, Hull HU8 9PW
| Today | See what it's worth now |
| 26 Feb 2026 | £119,000 |
| 24 Jan 2003 | £37,000 |
No other historical records.
26, Finchley Close, Hull HU8 0AN
| Today | See what it's worth now |
| 23 Feb 2026 | £155,000 |
| 8 Mar 2019 | £131,995 |
89, Western Gailes Way, Hull HU8 9EQ
| Today | See what it's worth now |
| 23 Feb 2026 | £195,000 |
| 31 May 2017 | £136,500 |
9, Howdale Road, Hull HU8 9JY
| Today | See what it's worth now |
| 20 Feb 2026 | £102,000 |
| 26 Oct 2023 | £97,500 |
6, Deal Close, Hull HU8 9XN
| Today | See what it's worth now |
| 20 Feb 2026 | £285,000 |
| 14 Jan 2005 | £195,000 |
No other historical records.
2, Camberwell Way, Hull HU8 0RT
| Today | See what it's worth now |
| 16 Feb 2026 | £280,000 |
| 5 Apr 2007 | £100,000 |
No other historical records.
28, Dunmow Close, Hull HU8 9NR
| Today | See what it's worth now |
| 13 Feb 2026 | £110,000 |
| 15 Jul 2016 | £70,000 |
No other historical records.
Source Acknowledgement: © Crown copyright. England and Wales house price data is publicly available information produced by the HM Land Registry.This material was last updated on 9 July 2026. It covers the period from 1 January 1995 to 30 April 2026 and contains property transactions which have been registered during that period. Contains HM Land Registry data © Crown copyright and database right 2026. This data is licensed under the Open Government Licence v3.0.
Disclaimer: Rightmove.co.uk provides this HM Land Registry data "as is". The burden for fitness of the data relies completely with the user and is provided for informational purposes only. No warranty, express or implied, is given relating to the accuracy of content of the HM Land Registry data and Rightmove does not accept any liability for error or omission. If you have found an error with the data or need further information please contact HM Land Registry.
Permitted Use: Viewers of this Information are granted permission to access this Crown copyright material and to download it onto electronic, magnetic, optical or similar storage media provided that such activities are for private research, study or in-house use only. Any other use of the material requires the formal written permission of Land Registry which can be requested from us, and is subject to an additional licence and associated charge.
Rightmove takes no liability for your use of, or reliance on, Rightmove's Instant Valuation due to the limitations of our tracking tool listed here. Use of this tool is taken entirely at your own risk. All rights reserved.