
House Prices in TW15
House prices in TW15 have an overall average of £461,440 over the last year.
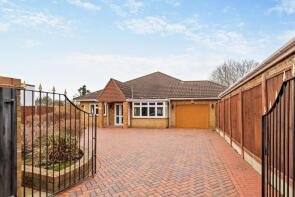
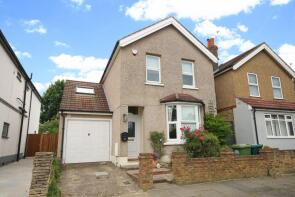
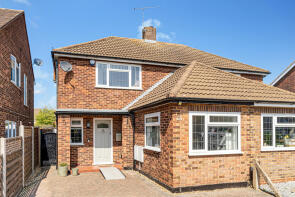
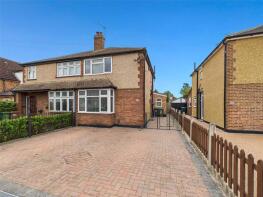
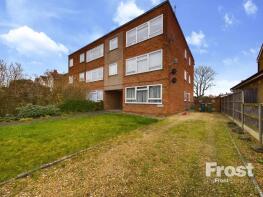
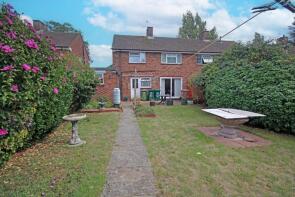
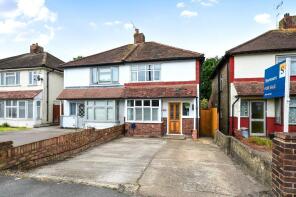
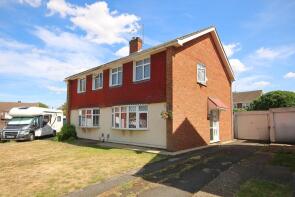
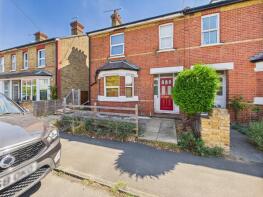
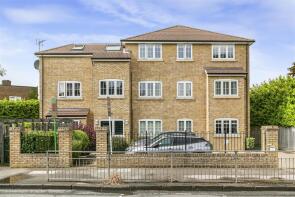
The majority of properties sold in TW15 during the last year were semi-detached properties, selling for an average price of £514,527. Flats sold for an average of £280,826, with detached properties fetching £634,084.
Overall, the historical sold prices in TW15 over the last year were 1% up on the previous year and 7% up on the 2023 peak of £430,155.
Properties Sold
8, 65 67 Albany Court, Chertsey Road, Ashford TW15 1SU
| Today | See what it's worth now |
| 10 Apr 2026 | £305,000 |
| 16 Jun 2022 | £295,000 |
21, Warwick Road, Ashford TW15 3PQ
| Today | See what it's worth now |
| 7 Apr 2026 | £360,000 |
| 22 Sep 1997 | £85,000 |
No other historical records.
39, Wrens Avenue, Ashford TW15 1AP
| Today | See what it's worth now |
| 31 Mar 2026 | £465,500 |
| 29 Sep 2000 | £104,000 |
No other historical records.
Extensions and planning permission in TW15
See planning approval stats, extension build costs and value added estimates.

18, Gilmore Crescent, Ashford TW15 2DB

| Today | See what it's worth now |
| 31 Mar 2026 | £570,000 |
No other historical records.
7, Squires Walk, Ashford TW15 1TS

| Today | See what it's worth now |
| 31 Mar 2026 | £275,000 |
| 28 Feb 2003 | £132,500 |
20, Coleridge Road, Ashford TW15 2QS
| Today | See what it's worth now |
| 23 Mar 2026 | £330,000 |
| 14 Jan 2022 | £515,000 |
12, Caroline Court, Ashford TW15 2AW

| Today | See what it's worth now |
| 20 Mar 2026 | £605,000 |
| 8 Jan 2020 | £500,000 |
No other historical records.
1, Glen Avenue, Ashford TW15 2JE
| Today | See what it's worth now |
| 20 Mar 2026 | £915,000 |
No other historical records.
43, Stanley Road, Ashford TW15 2LP
| Today | See what it's worth now |
| 20 Mar 2026 | £590,000 |
| 15 Jul 2002 | £250,000 |
No other historical records.
68, Lynegrove Avenue, Ashford TW15 1ER
| Today | See what it's worth now |
| 19 Mar 2026 | £470,000 |
| 5 May 2016 | £360,000 |
No other historical records.
38, Desford Way, Ashford TW15 3AT

| Today | See what it's worth now |
| 18 Mar 2026 | £505,000 |
| 31 May 2000 | £124,950 |
No other historical records.
27, Fernhurst Road, Ashford TW15 1AQ
| Today | See what it's worth now |
| 12 Mar 2026 | £485,000 |
No other historical records.
7, Virginia Court, Stanwell Road, Ashford TW15 3QJ
| Today | See what it's worth now |
| 10 Mar 2026 | £212,000 |
| 23 Nov 2018 | £243,000 |
47, Ruggles Brise Road, Ashford TW15 3LD
| Today | See what it's worth now |
| 6 Mar 2026 | £425,000 |
No other historical records.
14, Spelthorne Lane, Ashford TW15 1UJ
| Today | See what it's worth now |
| 6 Mar 2026 | £402,000 |
| 20 Feb 2017 | £315,000 |
No other historical records.
10, Mayfield Close, Ashford TW15 2AT
| Today | See what it's worth now |
| 5 Mar 2026 | £465,000 |
| 7 Jan 2011 | £250,000 |
25, Stanwell Road, Ashford TW15 3EH
| Today | See what it's worth now |
| 3 Mar 2026 | £535,000 |
| 7 Feb 1997 | £121,000 |
No other historical records.
98, Chesterfield Road, Ashford TW15 2ND
| Today | See what it's worth now |
| 2 Mar 2026 | £260,000 |
| 4 Jan 2019 | £260,000 |
8, Eaton House, Chertsey Road, Ashford TW15 1SF
| Today | See what it's worth now |
| 27 Feb 2026 | £308,000 |
| 9 Nov 2023 | £315,000 |
12, Dencliffe, Church Road, Ashford TW15 2PF
| Today | See what it's worth now |
| 24 Feb 2026 | £225,000 |
| 25 Sep 2015 | £245,000 |
No other historical records.
2b, Fairholme Road, Ashford TW15 2LH
| Today | See what it's worth now |
| 23 Feb 2026 | £268,000 |
| 31 Aug 2021 | £243,000 |
117, Denman Drive, Ashford TW15 2AP
| Today | See what it's worth now |
| 19 Feb 2026 | £480,000 |
| 29 Jun 1999 | £134,950 |
No other historical records.
5, Eaton House, Chertsey Road, Ashford TW15 1SF
| Today | See what it's worth now |
| 18 Feb 2026 | £280,000 |
| 5 Jun 2019 | £309,450 |
No other historical records.
Source Acknowledgement: © Crown copyright. England and Wales house price data is publicly available information produced by the HM Land Registry.This material was last updated on 9 July 2026. It covers the period from 1 January 1995 to 30 April 2026 and contains property transactions which have been registered during that period. Contains HM Land Registry data © Crown copyright and database right 2026. This data is licensed under the Open Government Licence v3.0.
Disclaimer: Rightmove.co.uk provides this HM Land Registry data "as is". The burden for fitness of the data relies completely with the user and is provided for informational purposes only. No warranty, express or implied, is given relating to the accuracy of content of the HM Land Registry data and Rightmove does not accept any liability for error or omission. If you have found an error with the data or need further information please contact HM Land Registry.
Permitted Use: Viewers of this Information are granted permission to access this Crown copyright material and to download it onto electronic, magnetic, optical or similar storage media provided that such activities are for private research, study or in-house use only. Any other use of the material requires the formal written permission of Land Registry which can be requested from us, and is subject to an additional licence and associated charge.
Rightmove takes no liability for your use of, or reliance on, Rightmove's Instant Valuation due to the limitations of our tracking tool listed here. Use of this tool is taken entirely at your own risk. All rights reserved.