
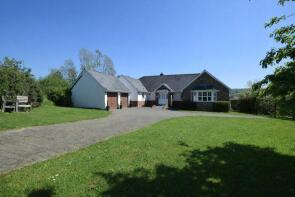
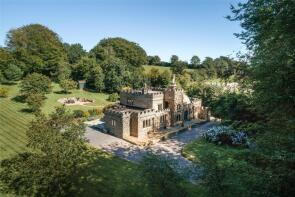
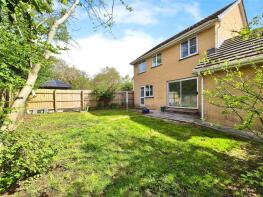
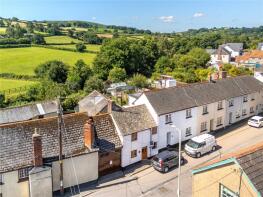
House Prices in Whiddon Valley
House prices in Whiddon Valley have an overall average of £273,301 over the last year.
The majority of properties sold in Whiddon Valley during the last year were terraced properties, selling for an average price of £219,785. Detached properties sold for an average of £395,460, with semi-detached properties fetching £282,694.
Overall, the historical sold prices in Whiddon Valley over the last year were 2% down on the previous year and 2% down on the 2022 peak of £280,196.
Properties Sold
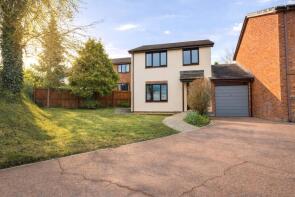
6, Mazzard Close, Barnstaple EX32 0LL
| Today | See what it's worth now |
| 23 Apr 2026 | £295,000 |
| 8 Jun 2001 | £92,000 |
No other historical records.
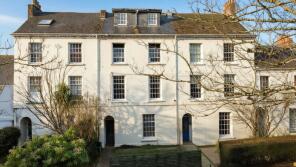
Flat 2, 6, Barbican Terrace, Barnstaple EX32 9HQ
| Today | See what it's worth now |
| 17 Apr 2026 | £125,000 |
| 27 Mar 2020 | £115,000 |
17, Barton Road, Barnstaple EX32 8NG
| Today | See what it's worth now |
| 7 Apr 2026 | £175,000 |
| 23 Jul 2012 | £129,500 |
Chestnut View, Goodleigh Road, Goodleigh, Barnstaple EX32 7NL
| Today | See what it's worth now |
| 2 Apr 2026 | £282,000 |
No other historical records.
37, Churchill Close, Barnstaple EX32 7HJ
| Today | See what it's worth now |
| 2 Apr 2026 | £180,000 |
| 7 Dec 2007 | £140,000 |
No other historical records.
80, Victoria Street, Barnstaple EX32 9JD
| Today | See what it's worth now |
| 1 Apr 2026 | £158,000 |
No other historical records.
18, Cyprus Terrace, Barnstaple EX32 9JF
| Today | See what it's worth now |
| 31 Mar 2026 | £170,000 |
| 29 Jun 2009 | £112,750 |
47, Speedwell Close, Barnstaple EX32 8PY
| Today | See what it's worth now |
| 30 Mar 2026 | £185,000 |
| 28 Feb 2024 | £170,000 |
26, Oak Tree Drive, Barnstaple EX32 0HE
| Today | See what it's worth now |
| 30 Mar 2026 | £285,000 |
| 7 Dec 2020 | £265,000 |
18, Appletree Close, Barnstaple EX32 8PN
| Today | See what it's worth now |
| 27 Mar 2026 | £188,000 |
| 28 Mar 2019 | £150,000 |
16, John Gay Road, Barnstaple EX32 8DA
| Today | See what it's worth now |
| 27 Mar 2026 | £234,000 |
No other historical records.
1, Valley View, Barnstaple EX32 0LW
| Today | See what it's worth now |
| 27 Mar 2026 | £470,000 |
| 19 Dec 2017 | £310,000 |
No other historical records.
East Hayes, Acland Road, Barnstaple EX32 0LB
| Today | See what it's worth now |
| 26 Mar 2026 | £715,000 |
| 23 Jul 2004 | £480,000 |
No other historical records.
36, Otter Way, Barnstaple EX32 8PS

| Today | See what it's worth now |
| 26 Mar 2026 | £224,000 |
| 2 Feb 2024 | £224,000 |
St Petroc, Road From Goodwells Head To Hudley Mill Bridge, Barnstaple EX32 7PY
| Today | See what it's worth now |
| 20 Mar 2026 | £840,000 |
| 28 Sep 2017 | £555,000 |
20, Hughes Avenue, Barnstaple EX32 9LN

| Today | See what it's worth now |
| 18 Mar 2026 | £250,000 |
| 6 Aug 2018 | £199,950 |
97, Victoria Street, Barnstaple EX32 9JA

| Today | See what it's worth now |
| 16 Mar 2026 | £175,000 |
| 23 Jun 2006 | £123,500 |
29, South Hayes Copse, Barnstaple EX32 0UZ
| Today | See what it's worth now |
| 13 Mar 2026 | £209,834 |
| 21 Nov 1997 | £99,750 |
No other historical records.
Rosetta Cottage, Blakes Hill Road, Barnstaple EX32 0LR
| Today | See what it's worth now |
| 9 Mar 2026 | £180,000 |
| 22 Jan 2021 | £165,000 |
13a, Lansdown Terrace, St Georges Road, Barnstaple EX32 7AW
| Today | See what it's worth now |
| 9 Mar 2026 | £230,000 |
| 14 Oct 2022 | £245,000 |
1, Higher Davis Close, Barnstaple EX32 7LD
| Today | See what it's worth now |
| 6 Mar 2026 | £450,000 |
| 20 Sep 2021 | £442,500 |
17, Hawthorn Road, Barnstaple EX32 8PU
| Today | See what it's worth now |
| 5 Mar 2026 | £202,500 |
| 2 May 2003 | £104,000 |
9 Kynance, Acland Road, Barnstaple EX32 0JZ
| Today | See what it's worth now |
| 27 Feb 2026 | £462,500 |
| 21 Mar 2007 | £170,000 |
No other historical records.
Source Acknowledgement: © Crown copyright. England and Wales house price data is publicly available information produced by the HM Land Registry.This material was last updated on 9 July 2026. It covers the period from 1 January 1995 to 30 April 2026 and contains property transactions which have been registered during that period. Contains HM Land Registry data © Crown copyright and database right 2026. This data is licensed under the Open Government Licence v3.0.
Disclaimer: Rightmove.co.uk provides this HM Land Registry data "as is". The burden for fitness of the data relies completely with the user and is provided for informational purposes only. No warranty, express or implied, is given relating to the accuracy of content of the HM Land Registry data and Rightmove does not accept any liability for error or omission. If you have found an error with the data or need further information please contact HM Land Registry.
Permitted Use: Viewers of this Information are granted permission to access this Crown copyright material and to download it onto electronic, magnetic, optical or similar storage media provided that such activities are for private research, study or in-house use only. Any other use of the material requires the formal written permission of Land Registry which can be requested from us, and is subject to an additional licence and associated charge.
Rightmove takes no liability for your use of, or reliance on, Rightmove's Instant Valuation due to the limitations of our tracking tool listed here. Use of this tool is taken entirely at your own risk. All rights reserved.