
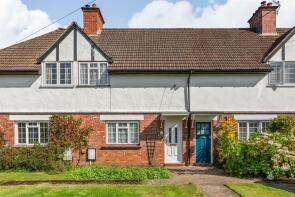
House Prices in Woldingham
House prices in Woldingham have an overall average of £1,212,500 over the last year.
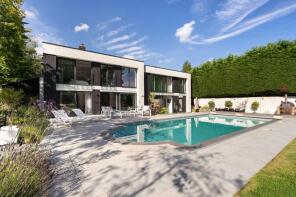
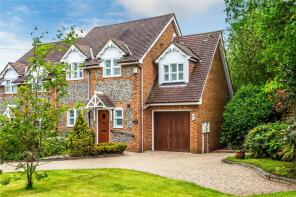
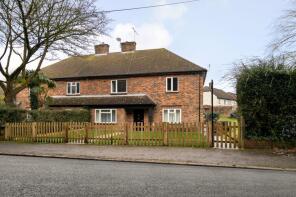
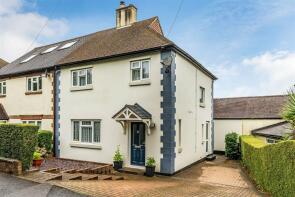
The majority of properties sold in Woldingham during the last year were detached properties, selling for an average price of £1,421,071. Semi-detached properties sold for an average of £650,000, with flats fetching £315,000.
Overall, the historical sold prices in Woldingham over the last year were 21% up on the previous year and 12% down on the 2023 peak of £1,379,265.
Properties Sold
Broomwood, Mimosa Drive, Woldingham CR3 7DF
| Today | See what it's worth now |
| 16 Feb 2026 | £1,150,000 |
No other historical records.
Westview, Southview Road, Caterham CR3 7AB
| Today | See what it's worth now |
| 14 Jan 2026 | £1,650,000 |
| 3 Dec 2004 | £900,000 |
Little Orchard, High Drive, Caterham CR3 7ED
| Today | See what it's worth now |
| 24 Oct 2025 | £2,125,000 |
| 30 Mar 2006 | £1,361,250 |
Littlecote, Tillingdown Lane, Caterham CR3 7JA
| Today | See what it's worth now |
| 29 Sep 2025 | £650,000 |
| 13 Nov 2020 | £550,000 |
No other historical records.
Charter House, Park View Road, Woldingham CR3 7DN
| Today | See what it's worth now |
| 18 Sep 2025 | £1,600,000 |
No other historical records.
Conewood, Upper Court Road, Caterham CR3 7BF
| Today | See what it's worth now |
| 29 Aug 2025 | £2,050,000 |
| 24 Jan 2003 | £575,000 |
2, Slines Court, Slines Oak Road, Caterham CR3 7EA

| Today | See what it's worth now |
| 6 Aug 2025 | £655,000 |
| 26 Feb 2021 | £570,000 |
4, Church Cottages, Slines Oak Road, Caterham CR3 7BJ
| Today | See what it's worth now |
| 6 Aug 2025 | £717,500 |
| 28 Sep 2018 | £582,500 |
7, Nethern Court Road, Caterham CR3 7EE
| Today | See what it's worth now |
| 29 Jul 2025 | £315,000 |
| 29 Mar 2019 | £275,000 |
Flat 4, Denewood, Park Ley Road, Woldingham CR3 7LD

| Today | See what it's worth now |
| 27 Jun 2025 | £640,000 |
No other historical records.
4, Ulstan Close, Caterham CR3 7EH
| Today | See what it's worth now |
| 30 May 2025 | £484,000 |
| 8 Oct 2012 | £250,000 |
No other historical records.
Little Dorcham, Long Hill, Caterham CR3 7LF
| Today | See what it's worth now |
| 28 May 2025 | £705,000 |
| 31 May 2019 | £400,000 |
No other historical records.
15, Hilltop Walk, Caterham CR3 7LJ
| Today | See what it's worth now |
| 9 Apr 2025 | £755,000 |
| 30 Mar 1999 | £272,500 |
No other historical records.
Wild Acre, Butlers Dene Road, Woldingham CR3 7HD
| Today | See what it's worth now |
| 27 Mar 2025 | £1,260,000 |
No other historical records.
West Ridge, The Ridge, Caterham CR3 7AX
| Today | See what it's worth now |
| 25 Mar 2025 | £640,000 |
| 21 Jan 1997 | £193,500 |
No other historical records.
4, Welcome Cottages, Slines Oak Road, Woldingham CR3 7EB
| Today | See what it's worth now |
| 24 Mar 2025 | £427,500 |
No other historical records.
Annsway, Upper Court Road, Caterham CR3 7BF
| Today | See what it's worth now |
| 5 Mar 2025 | £1,129,100 |
| 21 Jul 1995 | £170,000 |
No other historical records.
7, Church Road, Woldingham CR3 7JX
| Today | See what it's worth now |
| 19 Dec 2024 | £485,000 |
No other historical records.
Deauville Marden Manor, The Crescent, Station Road, Woldingham CR3 7DB
| Today | See what it's worth now |
| 19 Dec 2024 | £450,000 |
No other historical records.
Orchard House, Slines Oak Road, Woldingham CR3 7HL
| Today | See what it's worth now |
| 18 Dec 2024 | £822,000 |
No other historical records.
Jasmine Cottage, Station Road, Caterham CR3 7DA
| Today | See what it's worth now |
| 18 Dec 2024 | £1,435,000 |
| 15 Apr 2003 | £925,000 |
Grasslands, The Ridge, Caterham CR3 7AL
| Today | See what it's worth now |
| 13 Dec 2024 | £1,792,500 |
| 14 Aug 2020 | £1,375,000 |
Flat 4, Mimosa, Station Road, Caterham CR3 7DA
| Today | See what it's worth now |
| 12 Dec 2024 | £400,000 |
| 12 Mar 2007 | £250,000 |
No other historical records.
Source Acknowledgement: © Crown copyright. England and Wales house price data is publicly available information produced by the HM Land Registry.This material was last updated on 9 July 2026. It covers the period from 1 January 1995 to 30 April 2026 and contains property transactions which have been registered during that period. Contains HM Land Registry data © Crown copyright and database right 2026. This data is licensed under the Open Government Licence v3.0.
Disclaimer: Rightmove.co.uk provides this HM Land Registry data "as is". The burden for fitness of the data relies completely with the user and is provided for informational purposes only. No warranty, express or implied, is given relating to the accuracy of content of the HM Land Registry data and Rightmove does not accept any liability for error or omission. If you have found an error with the data or need further information please contact HM Land Registry.
Permitted Use: Viewers of this Information are granted permission to access this Crown copyright material and to download it onto electronic, magnetic, optical or similar storage media provided that such activities are for private research, study or in-house use only. Any other use of the material requires the formal written permission of Land Registry which can be requested from us, and is subject to an additional licence and associated charge.
Rightmove takes no liability for your use of, or reliance on, Rightmove's Instant Valuation due to the limitations of our tracking tool listed here. Use of this tool is taken entirely at your own risk. All rights reserved.