
House Prices in Worlingham
House prices in Worlingham have an overall average of £319,511 over the last year.
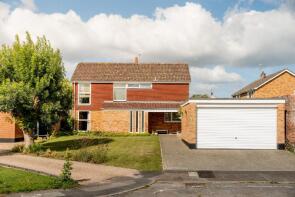
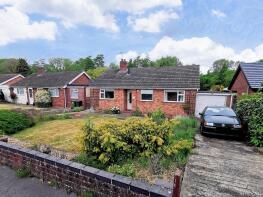
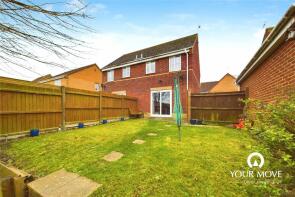
The majority of properties sold in Worlingham during the last year were detached properties, selling for an average price of £349,500. Semi-detached properties sold for an average of £261,808, with terraced properties fetching £170,000.
Overall, the historical sold prices in Worlingham over the last year were 4% down on the previous year and similar to the 2022 peak of £318,772.
Properties Sold
4 Oak House, Lowestoft Road, Beccles NR34 7EH
| Today | See what it's worth now |
| 1 Apr 2026 | £370,000 |
| 8 Mar 2010 | £200,000 |
6 Fair View, Rectory Lane, Beccles NR34 7RF
| Today | See what it's worth now |
| 1 Apr 2026 | £570,000 |
| 5 Sep 2023 | £545,000 |
28, All Saints Green, Beccles NR34 7RR

| Today | See what it's worth now |
| 31 Mar 2026 | £253,500 |
| 19 Nov 1999 | £65,000 |
6, Leggett Walk, Beccles NR34 7AU
| Today | See what it's worth now |
| 30 Mar 2026 | £285,000 |
| 9 Jul 2010 | £209,950 |
No other historical records.
45, Rowan Way, Beccles NR34 7ES
| Today | See what it's worth now |
| 20 Mar 2026 | £247,000 |
| 18 Dec 2006 | £139,500 |
16, Suttons Road, Beccles NR34 7SJ
| Today | See what it's worth now |
| 13 Mar 2026 | £245,000 |
| 17 Jan 2014 | £165,000 |
4, The Bridles, Beccles NR34 7RQ
| Today | See what it's worth now |
| 5 Mar 2026 | £435,000 |
| 24 Aug 2001 | £146,000 |
17, Highland Drive, Beccles NR34 7AP
| Today | See what it's worth now |
| 27 Feb 2026 | £230,000 |
| 29 Nov 2002 | £125,000 |
No other historical records.
43, Pepys Avenue, Beccles NR34 7SH
| Today | See what it's worth now |
| 27 Feb 2026 | £380,000 |
| 21 Feb 2014 | £210,000 |
16, Pepys Avenue, Beccles NR34 7SH
| Today | See what it's worth now |
| 20 Jan 2026 | £420,000 |
| 5 Dec 2003 | £196,350 |
No other historical records.
4, Paddocks Green, Beccles NR34 7RW
| Today | See what it's worth now |
| 13 Jan 2026 | £385,000 |
| 29 Aug 2014 | £275,000 |
2 Banbury Cross, The Chase, Beccles NR34 7DW

| Today | See what it's worth now |
| 9 Jan 2026 | £285,000 |
| 8 Apr 2022 | £170,000 |
29, Park Drive, Worlingham NR34 7DL
| Today | See what it's worth now |
| 7 Jan 2026 | £330,000 |
No other historical records.
2, Primrose Rise, Beccles NR34 7EY
| Today | See what it's worth now |
| 19 Dec 2025 | £285,000 |
| 11 Sep 2007 | £183,000 |
23, Newland Avenue, Beccles NR34 7AN
| Today | See what it's worth now |
| 19 Dec 2025 | £295,000 |
| 10 Jan 2012 | £181,000 |
6, Ash Tree Close, Beccles NR34 7RU
| Today | See what it's worth now |
| 17 Dec 2025 | £435,000 |
| 30 Aug 2006 | £265,000 |
4, Chestnut Close, Beccles NR34 7ER
| Today | See what it's worth now |
| 8 Dec 2025 | £255,000 |
| 22 Jul 2016 | £179,000 |
30, Guildhall Road, Beccles NR34 7SE
| Today | See what it's worth now |
| 1 Dec 2025 | £230,000 |
| 6 Jan 2006 | £140,000 |
10, Sheridan Walk, Worlingham NR34 7AS
| Today | See what it's worth now |
| 28 Nov 2025 | £186,000 |
No other historical records.
2, Orchard Rise, Beccles NR34 7RZ
| Today | See what it's worth now |
| 25 Nov 2025 | £435,000 |
| 25 Jul 2003 | £175,000 |
14, Sheridan Walk, Beccles NR34 7AS
| Today | See what it's worth now |
| 25 Nov 2025 | £310,000 |
| 7 Nov 2016 | £253,800 |
23, Rectory Lane, Beccles NR34 7RF
| Today | See what it's worth now |
| 17 Nov 2025 | £435,000 |
| 11 Oct 2019 | £325,000 |
3, Rectory Lane, Worlingham NR34 7RF
| Today | See what it's worth now |
| 28 Oct 2025 | £415,000 |
No other historical records.
Source Acknowledgement: © Crown copyright. England and Wales house price data is publicly available information produced by the HM Land Registry.This material was last updated on 9 July 2026. It covers the period from 1 January 1995 to 30 April 2026 and contains property transactions which have been registered during that period. Contains HM Land Registry data © Crown copyright and database right 2026. This data is licensed under the Open Government Licence v3.0.
Disclaimer: Rightmove.co.uk provides this HM Land Registry data "as is". The burden for fitness of the data relies completely with the user and is provided for informational purposes only. No warranty, express or implied, is given relating to the accuracy of content of the HM Land Registry data and Rightmove does not accept any liability for error or omission. If you have found an error with the data or need further information please contact HM Land Registry.
Permitted Use: Viewers of this Information are granted permission to access this Crown copyright material and to download it onto electronic, magnetic, optical or similar storage media provided that such activities are for private research, study or in-house use only. Any other use of the material requires the formal written permission of Land Registry which can be requested from us, and is subject to an additional licence and associated charge.
Rightmove takes no liability for your use of, or reliance on, Rightmove's Instant Valuation due to the limitations of our tracking tool listed here. Use of this tool is taken entirely at your own risk. All rights reserved.