
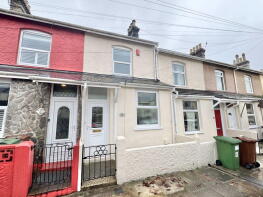
House Prices in Cattedown
House prices in Cattedown have an overall average of £187,466 over the last year.
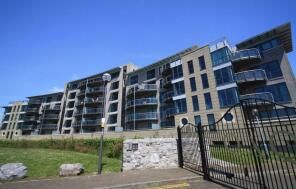
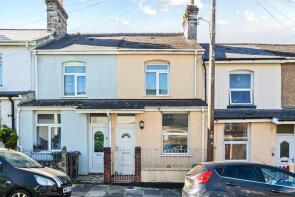
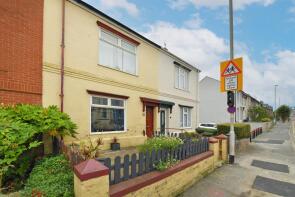
The majority of properties sold in Cattedown during the last year were terraced properties, selling for an average price of £186,354. Flats sold for an average of £190,643.
Overall, the historical sold prices in Cattedown over the last year were 18% up on the previous year and 8% up on the 2022 peak of £173,079.
Properties Sold
14, Home Sweet Home Terrace, Plymouth PL4 0QJ
| Today | See what it's worth now |
| 17 Apr 2026 | £147,500 |
| 4 Dec 2008 | £80,000 |
No other historical records.
Flat 24, 9, Parsonage Way, Plymouth PL4 0LY
| Today | See what it's worth now |
| 13 Mar 2026 | £310,000 |
| 11 Nov 2015 | £265,000 |
30, Home Sweet Home Terrace, Plymouth PL4 0QJ
| Today | See what it's worth now |
| 20 Feb 2026 | £165,000 |
| 5 Jun 2020 | £130,000 |
7, Florence Place, Plymouth PL4 9QQ
| Today | See what it's worth now |
| 11 Feb 2026 | £197,000 |
| 1 Apr 2010 | £83,000 |
80, Laira Bridge Road, Plymouth PL4 9LW
| Today | See what it's worth now |
| 6 Feb 2026 | £158,000 |
| 11 Aug 2023 | £125,000 |
No other historical records.
7, Parr Street, Plymouth PL4 0LA
| Today | See what it's worth now |
| 23 Jan 2026 | £211,000 |
| 6 Feb 1998 | £20,000 |
No other historical records.
30, Alvington Street, Plymouth PL4 0QL
| Today | See what it's worth now |
| 16 Jan 2026 | £186,000 |
| 27 Nov 2024 | £187,500 |
First Floor Flat, 23, St Leonards Road, Plymouth PL4 9NF

| Today | See what it's worth now |
| 11 Dec 2025 | £110,000 |
| 9 Oct 2018 | £94,000 |
69a, St Leonards Road, Plymouth PL4 9NF
| Today | See what it's worth now |
| 11 Dec 2025 | £207,000 |
| 7 May 2004 | £120,000 |
10b, River View, Plymouth PL4 9NR
| Today | See what it's worth now |
| 3 Dec 2025 | £135,000 |
| 3 May 2024 | £130,000 |
39, South Milton Street, Plymouth PL4 0QE
| Today | See what it's worth now |
| 26 Nov 2025 | £220,000 |
| 21 May 1999 | £37,950 |
19b, Radford Avenue, Plymouth PL4 9PD
| Today | See what it's worth now |
| 21 Nov 2025 | £138,500 |
| 8 Apr 2019 | £101,000 |
3, Commercial Place, Teats Hill Road, Plymouth PL4 0LS
| Today | See what it's worth now |
| 18 Nov 2025 | £203,500 |
| 13 Apr 2022 | £185,000 |
4, Alma Cottages, Plymouth PL4 0JN

| Today | See what it's worth now |
| 14 Nov 2025 | £75,000 |
| 28 Mar 2008 | £91,500 |
No other historical records.
Flat 34, 9, Parsonage Way, Plymouth PL4 0LY
| Today | See what it's worth now |
| 6 Nov 2025 | £425,000 |
| 26 Jul 2004 | £302,000 |
No other historical records.
13, Tothill Road, Plymouth PL4 9HU
| Today | See what it's worth now |
| 26 Sep 2025 | £190,000 |
| 16 Aug 2002 | £99,950 |
48, Cromwell Road, Plymouth PL4 9QP
| Today | See what it's worth now |
| 23 Sep 2025 | £197,500 |
| 19 Aug 2005 | £126,000 |
No other historical records.
4, Cotehele Avenue, Prince Rock, Plymouth PL4 9NG
| Today | See what it's worth now |
| 10 Sep 2025 | £102,500 |
| 6 Sep 2019 | £88,500 |
56, Cotehele Avenue, Prince Rock, Plymouth PL4 9NG
| Today | See what it's worth now |
| 10 Sep 2025 | £245,000 |
| 27 Jun 2018 | £157,250 |
19, Home Sweet Home Terrace, Plymouth PL4 0QJ
| Today | See what it's worth now |
| 9 Sep 2025 | £162,000 |
| 7 Dec 2018 | £135,000 |
76, Alvington Street, Plymouth PL4 0QL
| Today | See what it's worth now |
| 15 Aug 2025 | £157,000 |
| 8 Nov 2019 | £116,500 |
22, Elliott Road, Plymouth PL4 9NJ
| Today | See what it's worth now |
| 5 Aug 2025 | £246,584 |
| 4 Aug 2021 | £172,500 |
92, Laira Bridge Road, Plymouth PL4 9LW
| Today | See what it's worth now |
| 30 Jul 2025 | £182,000 |
| 28 Sep 2018 | £145,000 |
Source Acknowledgement: © Crown copyright. England and Wales house price data is publicly available information produced by the HM Land Registry.This material was last updated on 9 July 2026. It covers the period from 1 January 1995 to 30 April 2026 and contains property transactions which have been registered during that period. Contains HM Land Registry data © Crown copyright and database right 2026. This data is licensed under the Open Government Licence v3.0.
Disclaimer: Rightmove.co.uk provides this HM Land Registry data "as is". The burden for fitness of the data relies completely with the user and is provided for informational purposes only. No warranty, express or implied, is given relating to the accuracy of content of the HM Land Registry data and Rightmove does not accept any liability for error or omission. If you have found an error with the data or need further information please contact HM Land Registry.
Permitted Use: Viewers of this Information are granted permission to access this Crown copyright material and to download it onto electronic, magnetic, optical or similar storage media provided that such activities are for private research, study or in-house use only. Any other use of the material requires the formal written permission of Land Registry which can be requested from us, and is subject to an additional licence and associated charge.
Rightmove takes no liability for your use of, or reliance on, Rightmove's Instant Valuation due to the limitations of our tracking tool listed here. Use of this tool is taken entirely at your own risk. All rights reserved.