
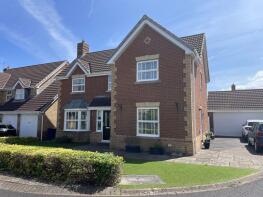
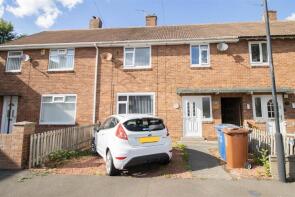
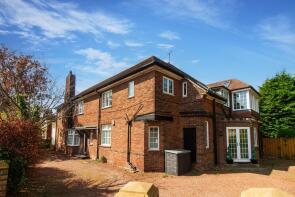
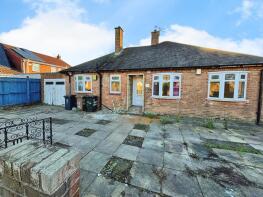
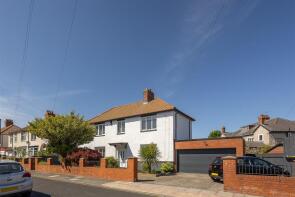
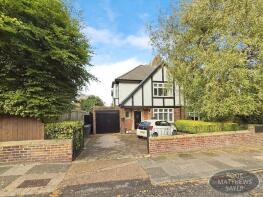
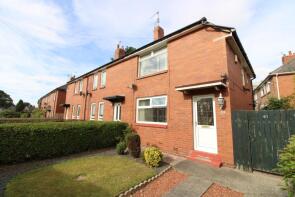
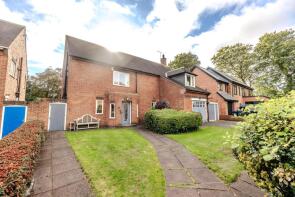
House Prices in Cochrane Park
House prices in Cochrane Park have an overall average of £260,556 over the last year.
The majority of properties sold in Cochrane Park during the last year were semi-detached properties, selling for an average price of £290,711. Terraced properties sold for an average of £254,935, with flats fetching £135,744.
Overall, the historical sold prices in Cochrane Park over the last year were 5% up on the previous year and 4% down on the 2022 peak of £271,042.
Properties Sold
35, Coast Road, Newcastle Upon Tyne NE7 7RN
| Today | See what it's worth now |
| 9 Apr 2026 | £216,000 |
| 3 Sep 2014 | £145,000 |
No other historical records.
28, Wyncote Court, Newcastle Upon Tyne NE7 7BG
| Today | See what it's worth now |
| 2 Apr 2026 | £310,000 |
| 13 Dec 2017 | £225,665 |
30, Horsley Road, Newcastle Upon Tyne NE7 7BN
| Today | See what it's worth now |
| 23 Mar 2026 | £200,000 |
| 1 Jun 2005 | £135,000 |
No other historical records.
32, Ministry Close, Newcastle Upon Tyne NE7 7NF
| Today | See what it's worth now |
| 20 Mar 2026 | £200,000 |
| 3 Sep 2021 | £168,000 |
10, Moralee Close, Little Benton, Newcastle Upon Tyne NE7 7GE
| Today | See what it's worth now |
| 20 Mar 2026 | £525,000 |
| 26 Nov 1999 | £157,500 |
11, Dunlop Close, Manor Park, Newcastle Upon Tyne NE7 7TS
| Today | See what it's worth now |
| 17 Mar 2026 | £175,500 |
No other historical records.
187, Benton Road, Newcastle Upon Tyne NE7 7DX
| Today | See what it's worth now |
| 13 Mar 2026 | £340,000 |
| 30 Oct 2020 | £299,999 |
13, Manor Gardens, Benton NE7 7XP
| Today | See what it's worth now |
| 13 Mar 2026 | £180,000 |
No other historical records.
45, Old Campus Close, Newcastle Upon Tyne NE7 7QB
| Today | See what it's worth now |
| 13 Mar 2026 | £267,500 |
| 13 Dec 2019 | £234,995 |
No other historical records.
67, Fairways Avenue, Newcastle Upon Tyne NE7 7UE
| Today | See what it's worth now |
| 5 Mar 2026 | £162,000 |
| 8 Jan 2018 | £128,950 |
2, Carnoustie Close, Newcastle Upon Tyne NE7 7TQ
| Today | See what it's worth now |
| 27 Feb 2026 | £360,000 |
| 28 Jul 2022 | £125,000 |
65, Bretton Gardens, Newcastle Upon Tyne NE7 7JT
| Today | See what it's worth now |
| 26 Feb 2026 | £276,250 |
| 4 Jul 2013 | £157,500 |
11, Birchwood Avenue, Newcastle Upon Tyne NE7 7PQ
| Today | See what it's worth now |
| 26 Feb 2026 | £160,000 |
| 27 Feb 2009 | £100,000 |
4, The Drive, Benton, Newcastle Upon Tyne NE7 7SY
| Today | See what it's worth now |
| 25 Feb 2026 | £400,000 |
No other historical records.
3, Glaisdale Road, Newcastle Upon Tyne NE7 7NH
| Today | See what it's worth now |
| 25 Feb 2026 | £410,000 |
| 14 Feb 2023 | £340,000 |
21, Hiddleston Avenue, Newcastle Upon Tyne NE7 7NJ

| Today | See what it's worth now |
| 20 Feb 2026 | £377,000 |
| 4 Jan 2019 | £235,000 |
No other historical records.
61, Holystone Crescent, Newcastle Upon Tyne NE7 7EU
| Today | See what it's worth now |
| 20 Feb 2026 | £170,000 |
| 1 Nov 2006 | £133,000 |
3, Loweswood Close, Manor Park, Newcastle Upon Tyne NE7 7DD
| Today | See what it's worth now |
| 18 Feb 2026 | £821,000 |
No other historical records.
12, Sherfield Drive, Manor Park, Newcastle Upon Tyne NE7 7LN
| Today | See what it's worth now |
| 18 Feb 2026 | £203,000 |
No other historical records.
27, Amberley Gardens, Newcastle Upon Tyne NE7 7JR
| Today | See what it's worth now |
| 18 Feb 2026 | £237,500 |
| 3 Feb 2017 | £170,000 |
8, The Wills Building, Wills Oval, Newcastle Upon Tyne NE7 7RW

| Today | See what it's worth now |
| 16 Feb 2026 | £125,000 |
| 19 Mar 2019 | £110,000 |
10, Fairways Avenue, Newcastle Upon Tyne NE7 7UB
| Today | See what it's worth now |
| 13 Feb 2026 | £235,000 |
| 25 Aug 2017 | £135,500 |
No other historical records.
31, Wyncote Court, Newcastle Upon Tyne NE7 7BG
| Today | See what it's worth now |
| 12 Feb 2026 | £282,500 |
| 3 Nov 2005 | £238,000 |
Source Acknowledgement: © Crown copyright. England and Wales house price data is publicly available information produced by the HM Land Registry.This material was last updated on 9 July 2026. It covers the period from 1 January 1995 to 30 April 2026 and contains property transactions which have been registered during that period. Contains HM Land Registry data © Crown copyright and database right 2026. This data is licensed under the Open Government Licence v3.0.
Disclaimer: Rightmove.co.uk provides this HM Land Registry data "as is". The burden for fitness of the data relies completely with the user and is provided for informational purposes only. No warranty, express or implied, is given relating to the accuracy of content of the HM Land Registry data and Rightmove does not accept any liability for error or omission. If you have found an error with the data or need further information please contact HM Land Registry.
Permitted Use: Viewers of this Information are granted permission to access this Crown copyright material and to download it onto electronic, magnetic, optical or similar storage media provided that such activities are for private research, study or in-house use only. Any other use of the material requires the formal written permission of Land Registry which can be requested from us, and is subject to an additional licence and associated charge.
Rightmove takes no liability for your use of, or reliance on, Rightmove's Instant Valuation due to the limitations of our tracking tool listed here. Use of this tool is taken entirely at your own risk. All rights reserved.