
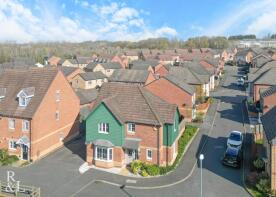
House Prices in DE11
House prices in DE11 have an overall average of £231,758 over the last year.
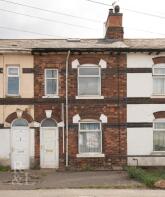
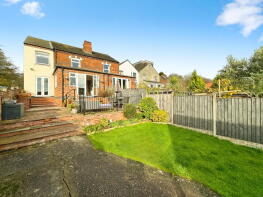
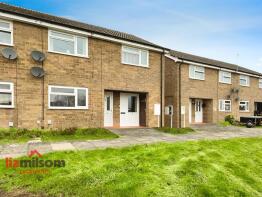
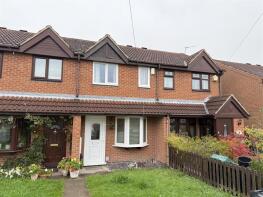
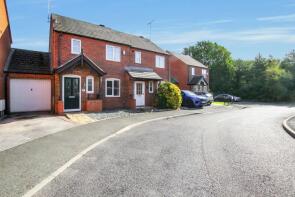
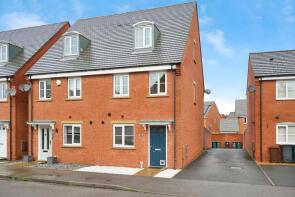
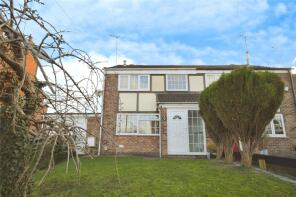
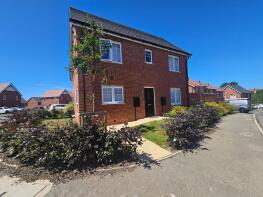
The majority of properties sold in DE11 during the last year were semi-detached properties, selling for an average price of £204,925. Detached properties sold for an average of £313,776, with terraced properties fetching £167,111.
Overall, the historical sold prices in DE11 over the last year were 2% down on the previous year and similar to the 2023 peak of £232,622.
Properties Sold
23, Thorn Street, Woodville, Swadlincote DE11 7DN

| Today | See what it's worth now |
| 24 Apr 2026 | £135,000 |
| 19 Dec 2013 | £67,500 |
1, Reading Avenue, Church Gresley, Swadlincote DE11 9TA
| Today | See what it's worth now |
| 24 Apr 2026 | £288,000 |
| 24 Sep 2021 | £255,000 |
46, Meynell Street, Church Gresley, Swadlincote DE11 9LS
| Today | See what it's worth now |
| 24 Apr 2026 | £235,000 |
| 5 May 2017 | £185,000 |
No other historical records.
Extensions and planning permission in DE11
See planning approval stats, extension build costs and value added estimates.

84, Suffolk Way, Church Gresley, Swadlincote DE11 9GL
| Today | See what it's worth now |
| 24 Apr 2026 | £284,000 |
| 29 Aug 2014 | £186,995 |
No other historical records.
8, Ivatt Close, Midway, Swadlincote DE11 7FZ
| Today | See what it's worth now |
| 24 Apr 2026 | £235,000 |
| 23 Jun 2023 | £224,950 |
No other historical records.
12, Astbury Way, Woodville, Swadlincote DE11 7BQ
| Today | See what it's worth now |
| 22 Apr 2026 | £250,000 |
| 7 Feb 2020 | £201,500 |
No other historical records.
48, Hearthcote Road, Swadlincote DE11 9DU
| Today | See what it's worth now |
| 17 Apr 2026 | £137,500 |
| 22 Jan 2016 | £77,500 |
42, Common Side, Church Gresley, Swadlincote DE11 9NN
| Today | See what it's worth now |
| 17 Apr 2026 | £280,000 |
| 5 May 2006 | £103,000 |
No other historical records.
8, Cheviot Close, Swadlincote DE11 9EE

| Today | See what it's worth now |
| 17 Apr 2026 | £222,500 |
| 27 Jul 2009 | £115,000 |
40, Fairfield Crescent, Newhall, Swadlincote DE11 0SX
| Today | See what it's worth now |
| 17 Apr 2026 | £102,500 |
| 19 Dec 2018 | £83,000 |
7, Thorn Street Mews, Thorn Street, Woodville, Swadlincote DE11 7DS
| Today | See what it's worth now |
| 17 Apr 2026 | £143,000 |
| 8 Jul 2004 | £79,500 |
6, Castle Croft, Castle Gresley, Swadlincote DE11 9HH
| Today | See what it's worth now |
| 17 Apr 2026 | £200,000 |
| 30 Sep 2010 | £117,500 |
25, Davenport Way, Woodville, Swadlincote DE11 7BH
| Today | See what it's worth now |
| 17 Apr 2026 | £220,000 |
| 24 Jul 2020 | £174,950 |
8, Woodward Way, Swadlincote DE11 8EP

| Today | See what it's worth now |
| 8 Apr 2026 | £340,000 |
| 20 Jun 2013 | £219,000 |
20, Brook Street, Swadlincote DE11 9EB
| Today | See what it's worth now |
| 7 Apr 2026 | £197,000 |
| 11 Nov 2005 | £129,000 |
No other historical records.
31, Marble Drive, Newhall, Swadlincote DE11 0YJ
| Today | See what it's worth now |
| 2 Apr 2026 | £240,000 |
| 18 Aug 2023 | £252,950 |
No other historical records.
4, Bluebell Grove, Woodville, Swadlincote DE11 8FY
| Today | See what it's worth now |
| 1 Apr 2026 | £325,000 |
| 25 Jun 2021 | £285,000 |
60, Coronation Street, Swadlincote DE11 0QB

| Today | See what it's worth now |
| 1 Apr 2026 | £291,000 |
| 2 Jul 1999 | £84,950 |
No other historical records.
17, Pickering Drive, Swadlincote DE11 8GL
| Today | See what it's worth now |
| 31 Mar 2026 | £230,000 |
| 12 Dec 2019 | £187,495 |
No other historical records.
10, Ashford Way, Church Gresley, Swadlincote DE11 9TP
| Today | See what it's worth now |
| 31 Mar 2026 | £230,000 |
| 29 Jun 2012 | £145,000 |
No other historical records.
430, Burton Road, Midway, Swadlincote DE11 0DW
| Today | See what it's worth now |
| 31 Mar 2026 | £280,000 |
| 27 Aug 2021 | £249,950 |
9, Bodell Close, Newhall, Swadlincote DE11 0FT
| Today | See what it's worth now |
| 30 Mar 2026 | £203,000 |
| 24 Nov 2017 | £154,950 |
No other historical records.
30, Rockcliffe Close, Church Gresley, Swadlincote DE11 9FD
| Today | See what it's worth now |
| 30 Mar 2026 | £182,500 |
| 29 Jun 2023 | £210,000 |
No other historical records.
Source Acknowledgement: © Crown copyright. England and Wales house price data is publicly available information produced by the HM Land Registry.This material was last updated on 9 July 2026. It covers the period from 1 January 1995 to 30 April 2026 and contains property transactions which have been registered during that period. Contains HM Land Registry data © Crown copyright and database right 2026. This data is licensed under the Open Government Licence v3.0.
Disclaimer: Rightmove.co.uk provides this HM Land Registry data "as is". The burden for fitness of the data relies completely with the user and is provided for informational purposes only. No warranty, express or implied, is given relating to the accuracy of content of the HM Land Registry data and Rightmove does not accept any liability for error or omission. If you have found an error with the data or need further information please contact HM Land Registry.
Permitted Use: Viewers of this Information are granted permission to access this Crown copyright material and to download it onto electronic, magnetic, optical or similar storage media provided that such activities are for private research, study or in-house use only. Any other use of the material requires the formal written permission of Land Registry which can be requested from us, and is subject to an additional licence and associated charge.
Rightmove takes no liability for your use of, or reliance on, Rightmove's Instant Valuation due to the limitations of our tracking tool listed here. Use of this tool is taken entirely at your own risk. All rights reserved.