
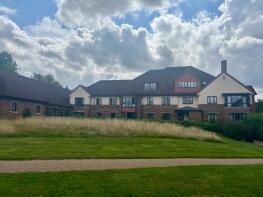
House Prices in Ditchling Common
House prices in Ditchling Common have an overall average of £527,429 over the last year.
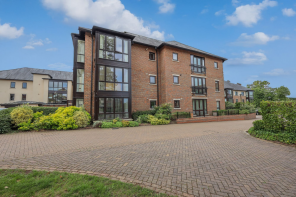
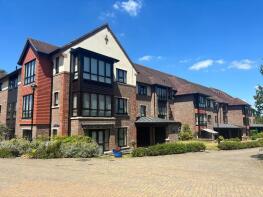
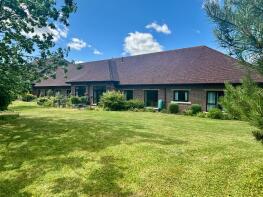
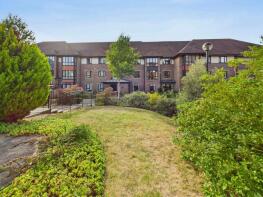
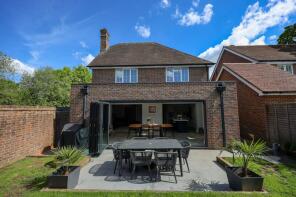
The majority of properties sold in Ditchling Common during the last year were flats, selling for an average price of £470,000. Detached properties sold for an average of £738,000.
Overall, the historical sold prices in Ditchling Common over the last year were 3% up on the previous year and 7% up on the 2021 peak of £494,962.
Properties Sold
87 Whitegates, Folders Lane, Burgess Hill RH15 0DY
| Today | See what it's worth now |
| 19 Mar 2026 | £785,000 |
| 10 Mar 2022 | £750,000 |
Flat 30, The Cedars St Georges Park, Ditchling Road, Ditchling Common, Burgess Hill RH15 0GR
| Today | See what it's worth now |
| 6 Mar 2026 | £595,000 |
| 30 Mar 2012 | £402,500 |
No other historical records.
Flat 23, Maple Court St Georges Park, Ditchling Road, Ditchling Common, Burgess Hill RH15 0SW
| Today | See what it's worth now |
| 4 Mar 2026 | £485,000 |
| 12 Dec 2006 | £325,000 |
No other historical records.
Flat 12, Birch Walk St Georges Park, Ditchling Road, Ditchling Common, Burgess Hill RH15 0SA
| Today | See what it's worth now |
| 26 Feb 2026 | £430,000 |
| 6 Aug 2021 | £360,000 |
No other historical records.
Pottery House, Folders Lane East, Hassocks BN6 8SJ

| Today | See what it's worth now |
| 25 Feb 2026 | £800,000 |
| 17 Nov 2023 | £715,000 |
Flat 22, Mulberry Walk St Georges Park, Ditchling Road, Ditchling Common, Burgess Hill RH15 0SZ
| Today | See what it's worth now |
| 11 Feb 2026 | £485,000 |
| 27 Feb 2018 | £420,000 |
Flat 25, Birch Walk St Georges Park, Ditchling Road, Ditchling Common, Burgess Hill RH15 0SA
| Today | See what it's worth now |
| 6 Jan 2026 | £440,000 |
| 10 May 2022 | £395,000 |
Flat 4, Mulberry Walk St Georges Park, Ditchling Road, Ditchling Common, Burgess Hill RH15 0SZ
| Today | See what it's worth now |
| 14 Nov 2025 | £450,000 |
| 29 Nov 2018 | £380,000 |
Flat 23, Oakview Court St Georges Park, Ditchling Road, Ditchling Common, Burgess Hill RH15 0SG
| Today | See what it's worth now |
| 10 Oct 2025 | £410,000 |
| 17 Jun 2021 | £355,000 |
Flat 15, Birch Walk St Georges Park, Ditchling Road, Ditchling Common, Burgess Hill RH15 0SA
| Today | See what it's worth now |
| 3 Sep 2025 | £425,000 |
| 30 Jun 2009 | £350,000 |
No other historical records.
Flat 31, Birch Walk St Georges Park, Ditchling Road, Ditchling Common, Burgess Hill RH15 0SA
| Today | See what it's worth now |
| 21 Aug 2025 | £360,000 |
| 20 Sep 2018 | £360,000 |
45, Sycamore Drive, Burgess Hill RH15 0GG
| Today | See what it's worth now |
| 11 Aug 2025 | £629,000 |
| 25 Jul 2014 | £398,000 |
Flat 36, Oakview Court St Georges Park, Ditchling Road, Ditchling Common, Burgess Hill RH15 0SG
| Today | See what it's worth now |
| 15 Jul 2025 | £490,000 |
| 17 Aug 2007 | £330,000 |
No other historical records.
Flat 12, Mulberry Walk St Georges Park, Ditchling Road, Ditchling Common, Burgess Hill RH15 0SZ
| Today | See what it's worth now |
| 1 Jul 2025 | £600,000 |
| 27 Nov 2008 | £545,000 |
No other historical records.
Flat 18, Oakview Court St Georges Park, Ditchling Road, Ditchling Common, Burgess Hill RH15 0SG
| Today | See what it's worth now |
| 11 Jun 2025 | £440,000 |
| 21 Dec 2022 | £380,000 |
24, Reeves Mead, Burgess Hill RH15 0YR
| Today | See what it's worth now |
| 30 Apr 2025 | £475,000 |
No other historical records.
13, Great Park Meadow, Burgess Hill RH15 0YL
| Today | See what it's worth now |
| 29 Apr 2025 | £470,250 |
No other historical records.
Flat 3, The Cedars St Georges Park, Ditchling Road, Ditchling Common, Ditchling RH15 0GR
| Today | See what it's worth now |
| 29 Apr 2025 | £700,000 |
No other historical records.
35, Leigh Meadow, Burgess Hill RH15 0YP
| Today | See what it's worth now |
| 28 Mar 2025 | £520,000 |
No other historical records.
Freckborough Manor, Ditchling Road, Ditchling Common, Ditchling RH15 0SE
| Today | See what it's worth now |
| 28 Mar 2025 | £1,430,768 |
No other historical records.
27, Leigh Meadow, Burgess Hill RH15 0YP
| Today | See what it's worth now |
| 28 Mar 2025 | £451,250 |
No other historical records.
10, Weavers Close, Burgess Hill RH15 0QD

| Today | See what it's worth now |
| 20 Mar 2025 | £350,000 |
| 25 Jan 2019 | £288,500 |
Flat 27, Maple Court St Georges Park, Ditchling Road, Ditchling Common, Burgess Hill RH15 0SW
| Today | See what it's worth now |
| 13 Mar 2025 | £520,000 |
| 27 Aug 2009 | £370,000 |
Source Acknowledgement: © Crown copyright. England and Wales house price data is publicly available information produced by the HM Land Registry.This material was last updated on 9 July 2026. It covers the period from 1 January 1995 to 30 April 2026 and contains property transactions which have been registered during that period. Contains HM Land Registry data © Crown copyright and database right 2026. This data is licensed under the Open Government Licence v3.0.
Disclaimer: Rightmove.co.uk provides this HM Land Registry data "as is". The burden for fitness of the data relies completely with the user and is provided for informational purposes only. No warranty, express or implied, is given relating to the accuracy of content of the HM Land Registry data and Rightmove does not accept any liability for error or omission. If you have found an error with the data or need further information please contact HM Land Registry.
Permitted Use: Viewers of this Information are granted permission to access this Crown copyright material and to download it onto electronic, magnetic, optical or similar storage media provided that such activities are for private research, study or in-house use only. Any other use of the material requires the formal written permission of Land Registry which can be requested from us, and is subject to an additional licence and associated charge.
Rightmove takes no liability for your use of, or reliance on, Rightmove's Instant Valuation due to the limitations of our tracking tool listed here. Use of this tool is taken entirely at your own risk. All rights reserved.