
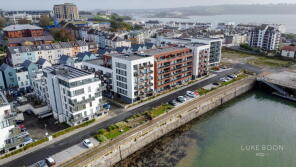
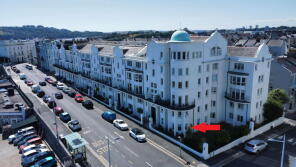
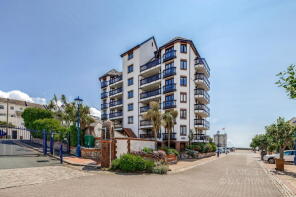
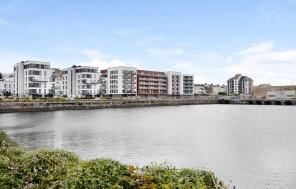
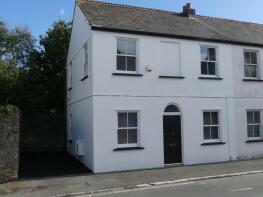
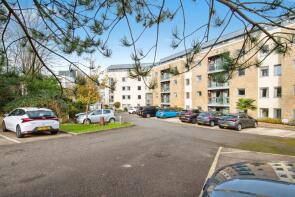
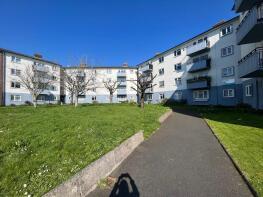
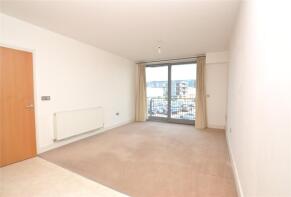
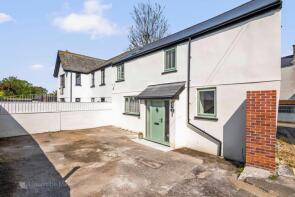
House Prices in Millbay
House prices in Millbay have an overall average of £244,182 over the last year.
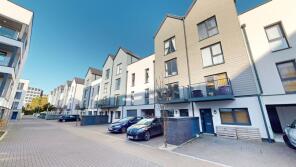
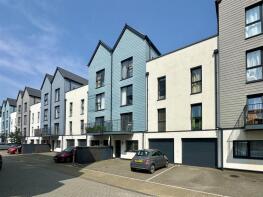
The majority of properties sold in Millbay during the last year were flats, selling for an average price of £215,958. Terraced properties sold for an average of £335,125, with semi-detached properties fetching £194,000.
Overall, the historical sold prices in Millbay over the last year were 3% down on the previous year and 16% down on the 2007 peak of £289,628.
Properties Sold
Flat 1, 2, Trinity Street, Plymouth PL1 3GG
| Today | See what it's worth now |
| 24 Apr 2026 | £285,000 |
| 12 Dec 2022 | £263,000 |
25, Willoughby Way, Plymouth PL1 3GA
| Today | See what it's worth now |
| 8 Apr 2026 | £236,000 |
| 5 Aug 2020 | £218,000 |
No other historical records.
56, West Hoe Road, Plymouth PL1 3FB

| Today | See what it's worth now |
| 30 Mar 2026 | £320,000 |
| 30 Nov 2020 | £275,000 |
No other historical records.
35, Willoughby Way, Plymouth PL1 3GA
| Today | See what it's worth now |
| 19 Mar 2026 | £240,000 |
| 18 Dec 2020 | £221,000 |
No other historical records.
Flat 3, 45, Citadel Road, Plymouth PL1 3AU
| Today | See what it's worth now |
| 17 Mar 2026 | £155,000 |
No other historical records.
28, Citadel Road, Plymouth PL1 3BA
| Today | See what it's worth now |
| 27 Feb 2026 | £165,500 |
| 26 Jan 2024 | £155,000 |
Flat 16, 21, Crescent Avenue, Plymouth PL1 3DT

| Today | See what it's worth now |
| 25 Feb 2026 | £270,000 |
| 6 Jun 2019 | £225,000 |
42, Emma Place, Plymouth PL1 3QT
| Today | See what it's worth now |
| 20 Feb 2026 | £110,000 |
| 30 Jun 2023 | £101,500 |
64, West Hoe Road, Plymouth PL1 3FB

| Today | See what it's worth now |
| 4 Feb 2026 | £320,000 |
| 10 Jan 2020 | £278,302 |
No other historical records.
Flat 4, 1 Wesley Court, Millbay Road, Plymouth PL1 3LB

| Today | See what it's worth now |
| 16 Jan 2026 | £160,000 |
| 26 Apr 2010 | £172,500 |
No other historical records.
Flat 4, 2, Hoe Road, Plymouth PL1 3DE

| Today | See what it's worth now |
| 19 Dec 2025 | £505,000 |
| 1 Feb 2018 | £520,000 |
No other historical records.
Flat 1, 8, Grand Parade, Plymouth PL1 3DF
| Today | See what it's worth now |
| 17 Dec 2025 | £282,500 |
| 18 Jan 2022 | £220,000 |
61, Millbay Road, Plymouth PL1 3NG
| Today | See what it's worth now |
| 16 Dec 2025 | £280,000 |
| 30 Apr 2014 | £217,000 |
No other historical records.
2c, Pier Street, Plymouth PL1 3BS

| Today | See what it's worth now |
| 12 Dec 2025 | £380,000 |
| 18 Jun 2021 | £335,000 |
No other historical records.
Flat 9, The Bridge, Custom House Lane, Plymouth PL1 3TB
| Today | See what it's worth now |
| 26 Nov 2025 | £245,000 |
| 23 Sep 2003 | £240,000 |
No other historical records.
Flat 19, 1, Kingdom Street, Plymouth PL1 3GJ
| Today | See what it's worth now |
| 19 Nov 2025 | £302,000 |
| 6 Sep 2021 | £265,000 |
No other historical records.
22, Brownlow Street, Millbay, Plymouth PL1 3PU
| Today | See what it's worth now |
| 18 Nov 2025 | £194,000 |
No other historical records.
51, Fin Street, Plymouth PL1 3FF

| Today | See what it's worth now |
| 14 Nov 2025 | £312,000 |
| 18 Oct 2019 | £275,000 |
Flat 17, 1 Wesley Court, Millbay Road, Plymouth PL1 3LB
| Today | See what it's worth now |
| 29 Oct 2025 | £136,000 |
| 8 Dec 2021 | £115,000 |
37, West Hoe Road, Plymouth PL1 3BH
| Today | See what it's worth now |
| 28 Oct 2025 | £140,000 |
| 25 Nov 2005 | £110,000 |
53, Brittany Street, Plymouth PL1 3FN
| Today | See what it's worth now |
| 17 Oct 2025 | £85,000 |
| 2 Sep 2009 | £119,950 |
No other historical records.
3, Crescent Avenue Mews, Plymouth PL1 3AP
| Today | See what it's worth now |
| 9 Oct 2025 | £505,000 |
| 5 Dec 2022 | £260,000 |
No other historical records.
Flat 6, 12, The Crescent, Plymouth PL1 3AB
| Today | See what it's worth now |
| 22 Sep 2025 | £155,000 |
| 12 May 2021 | £135,000 |
Source Acknowledgement: © Crown copyright. England and Wales house price data is publicly available information produced by the HM Land Registry.This material was last updated on 9 July 2026. It covers the period from 1 January 1995 to 30 April 2026 and contains property transactions which have been registered during that period. Contains HM Land Registry data © Crown copyright and database right 2026. This data is licensed under the Open Government Licence v3.0.
Disclaimer: Rightmove.co.uk provides this HM Land Registry data "as is". The burden for fitness of the data relies completely with the user and is provided for informational purposes only. No warranty, express or implied, is given relating to the accuracy of content of the HM Land Registry data and Rightmove does not accept any liability for error or omission. If you have found an error with the data or need further information please contact HM Land Registry.
Permitted Use: Viewers of this Information are granted permission to access this Crown copyright material and to download it onto electronic, magnetic, optical or similar storage media provided that such activities are for private research, study or in-house use only. Any other use of the material requires the formal written permission of Land Registry which can be requested from us, and is subject to an additional licence and associated charge.
Rightmove takes no liability for your use of, or reliance on, Rightmove's Instant Valuation due to the limitations of our tracking tool listed here. Use of this tool is taken entirely at your own risk. All rights reserved.