
House Prices in NE11
House prices in NE11 have an overall average of £173,480 over the last year.
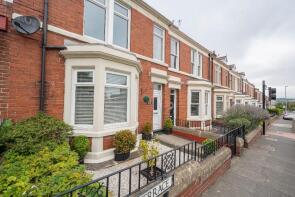
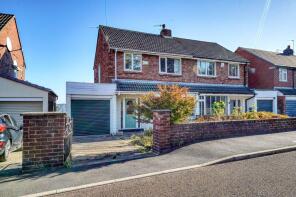
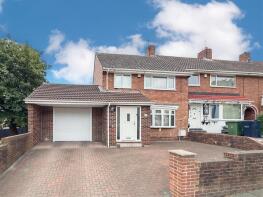
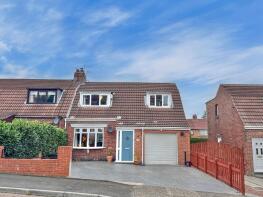
The majority of properties sold in NE11 during the last year were semi-detached properties, selling for an average price of £172,020. Terraced properties sold for an average of £158,682, with detached properties fetching £299,975.
Overall, the historical sold prices in NE11 over the last year were 7% down on the previous year and 12% down on the 2023 peak of £197,083.
Properties Sold
1, Park Terrace, Dunston Hill, Gateshead NE11 9PA
| Today | See what it's worth now |
| 21 Apr 2026 | £228,000 |
| 21 Aug 2013 | £83,000 |
48, Knoll Rise, Dunston Hill, Gateshead NE11 9QQ
| Today | See what it's worth now |
| 13 Apr 2026 | £193,000 |
No other historical records.
9, Moorfoot Gardens, Lobley Hill, Gateshead NE11 9LA
| Today | See what it's worth now |
| 10 Apr 2026 | £197,000 |
| 5 Feb 2007 | £133,500 |
No other historical records.
Extensions and planning permission in NE11
See planning approval stats, extension build costs and value added estimates.

13, King George Avenue, Dunston Hill, Gateshead NE11 9UP

| Today | See what it's worth now |
| 2 Apr 2026 | £160,000 |
| 29 Feb 2008 | £119,000 |
16, Douglas Gardens, Dunston Hill, Gateshead NE11 9RA
| Today | See what it's worth now |
| 2 Apr 2026 | £225,000 |
| 24 Jan 2020 | £178,000 |
10, Renforth Street, Dunston, Gateshead NE11 9BE
| Today | See what it's worth now |
| 2 Apr 2026 | £182,750 |
| 29 Mar 2019 | £122,000 |
6, Thornwood Gardens, Lobley Hill, Gateshead NE11 0DB
| Today | See what it's worth now |
| 2 Apr 2026 | £130,000 |
No other historical records.
6, Belford Gardens, Lobley Hill, Gateshead NE11 0AR
| Today | See what it's worth now |
| 2 Apr 2026 | £232,500 |
No other historical records.
2, Hollydene, Kibblesworth, Birtley NE11 0NR
| Today | See what it's worth now |
| 30 Mar 2026 | £325,000 |
No other historical records.
3, Clavering Square, Dunston Hill, Gateshead NE11 9PF
| Today | See what it's worth now |
| 25 Mar 2026 | £102,500 |
| 29 Nov 1996 | £36,000 |
No other historical records.
18, Parsons Gardens, Dunston, Gateshead NE11 9ET
| Today | See what it's worth now |
| 20 Mar 2026 | £126,500 |
| 14 Dec 2001 | £34,500 |
No other historical records.
149, Knightside Gardens, Dunston Hill, Gateshead NE11 9RP
| Today | See what it's worth now |
| 13 Mar 2026 | £117,000 |
| 6 May 2022 | £115,000 |
No other historical records.
417, Lobley Hill Road, Lobley Hill, Gateshead NE11 0BT
| Today | See what it's worth now |
| 13 Mar 2026 | £230,050 |
| 19 Aug 2013 | £157,000 |
26, Monkridge Gardens, Dunston Hill, Gateshead NE11 9XE
| Today | See what it's worth now |
| 12 Mar 2026 | £227,500 |
| 1 Jul 2022 | £190,000 |
31, Palatine Place, Dunston, Gateshead NE11 9SR
| Today | See what it's worth now |
| 3 Mar 2026 | £75,000 |
| 30 Nov 2006 | £111,950 |
No other historical records.
26, Gardiner Square, Kibblesworth, Gateshead NE11 0XS
| Today | See what it's worth now |
| 3 Mar 2026 | £160,000 |
| 29 Jun 2018 | £90,000 |
No other historical records.
46, Coach Road, Lobley Hill, Gateshead NE11 0DY
| Today | See what it's worth now |
| 27 Feb 2026 | £160,000 |
| 12 Jul 2013 | £109,000 |
No other historical records.
11, Grange Terrace, Kibblesworth, Birtley NE11 0XN
| Today | See what it's worth now |
| 26 Feb 2026 | £120,000 |
No other historical records.
Lynwood, Front Street, Kibblesworth, Birtley NE11 0XL
| Today | See what it's worth now |
| 23 Feb 2026 | £180,000 |
No other historical records.
27, Woodside Gardens, Dunston Hill, Gateshead NE11 9RB
| Today | See what it's worth now |
| 20 Feb 2026 | £165,000 |
| 14 Dec 2020 | £145,000 |
6, Festival Park Drive, Festival Park, Gateshead NE11 9TT
| Today | See what it's worth now |
| 20 Feb 2026 | £247,500 |
| 19 Jul 2013 | £175,000 |
31, Market Lane, Dunston Hill, Gateshead NE11 9NX
| Today | See what it's worth now |
| 13 Feb 2026 | £160,000 |
| 24 Nov 2021 | £135,000 |
29, Park Avenue, Dunston Hill, Gateshead NE11 9QE
| Today | See what it's worth now |
| 6 Feb 2026 | £402,000 |
| 22 Aug 2018 | £252,000 |
No other historical records.
Source Acknowledgement: © Crown copyright. England and Wales house price data is publicly available information produced by the HM Land Registry.This material was last updated on 9 July 2026. It covers the period from 1 January 1995 to 30 April 2026 and contains property transactions which have been registered during that period. Contains HM Land Registry data © Crown copyright and database right 2026. This data is licensed under the Open Government Licence v3.0.
Disclaimer: Rightmove.co.uk provides this HM Land Registry data "as is". The burden for fitness of the data relies completely with the user and is provided for informational purposes only. No warranty, express or implied, is given relating to the accuracy of content of the HM Land Registry data and Rightmove does not accept any liability for error or omission. If you have found an error with the data or need further information please contact HM Land Registry.
Permitted Use: Viewers of this Information are granted permission to access this Crown copyright material and to download it onto electronic, magnetic, optical or similar storage media provided that such activities are for private research, study or in-house use only. Any other use of the material requires the formal written permission of Land Registry which can be requested from us, and is subject to an additional licence and associated charge.
Rightmove takes no liability for your use of, or reliance on, Rightmove's Instant Valuation due to the limitations of our tracking tool listed here. Use of this tool is taken entirely at your own risk. All rights reserved.