
House Prices in NE9
House prices in NE9 have an overall average of £214,740 over the last year.
The majority of properties sold in NE9 during the last year were semi-detached properties, selling for an average price of £222,762. Terraced properties sold for an average of £200,388, with flats fetching £126,183.
Overall, the historical sold prices in NE9 over the last year were 3% up on the previous year and 3% up on the 2023 peak of £208,997.
Properties Sold
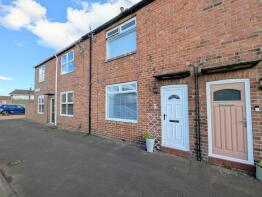
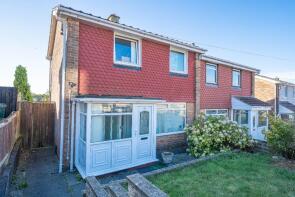
1, Prospect Terrace, Eighton Banks, Gateshead NE9 7YE
| Today | See what it's worth now |
| 24 Apr 2026 | £210,000 |
| 29 Sep 2017 | £167,000 |
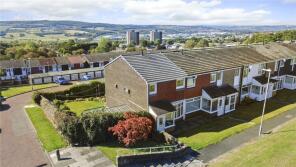
23, Tamarisk Way, Beacon Lough, Gateshead NE9 6GD
| Today | See what it's worth now |
| 20 Apr 2026 | £230,000 |
| 17 Aug 2001 | £87,950 |
No other historical records.
18, Stonecrop, Beacon Lough Estate, Gateshead NE9 6SB
| Today | See what it's worth now |
| 20 Apr 2026 | £90,000 |
| 23 Dec 2021 | £83,000 |
No other historical records.
Extensions and planning permission in NE9
See planning approval stats, extension build costs and value added estimates.

5, Yewdale Gardens, Lyndhurst, Gateshead NE9 6NU
| Today | See what it's worth now |
| 13 Apr 2026 | £225,000 |
| 28 Feb 1997 | £33,000 |
No other historical records.
19, Holyoake Gardens, Low Fell, Gateshead NE9 5DT
| Today | See what it's worth now |
| 10 Apr 2026 | £161,149 |
| 22 Nov 2024 | £135,000 |
2, Windsor Terrace, Springwell, Gateshead NE9 7QN
| Today | See what it's worth now |
| 8 Apr 2026 | £141,500 |
| 23 Feb 2018 | £123,000 |
29, Malton Green, Harlow Green, Gateshead NE9 7ED
| Today | See what it's worth now |
| 31 Mar 2026 | £130,500 |
No other historical records.
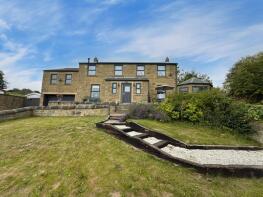
Vale Mount, Rockcliffe Way, Eighton Banks, Gateshead NE9 7YL
| Today | See what it's worth now |
| 30 Mar 2026 | £680,000 |
| 21 Mar 2023 | £500,000 |
No other historical records.
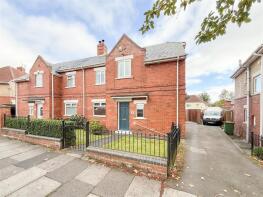
54, The Avenue, Carr Hill, Gateshead NE9 5PP
| Today | See what it's worth now |
| 30 Mar 2026 | £163,500 |
| 30 Oct 2015 | £112,000 |
2, Blacksmiths Forge, Cross Keys Lane, Low Fell, Gateshead NE9 6DA
| Today | See what it's worth now |
| 27 Mar 2026 | £316,100 |
No other historical records.
2, North Dene Drive, Shipcote, Gateshead NE9 5EH
| Today | See what it's worth now |
| 27 Mar 2026 | £285,000 |
| 29 Mar 2018 | £234,950 |
No other historical records.
14, Waldridge Gardens, Wrekenton, Gateshead NE9 7LE

| Today | See what it's worth now |
| 23 Mar 2026 | £155,000 |
No other historical records.
56, Earls Drive, Low Fell, Gateshead NE9 6AA

| Today | See what it's worth now |
| 20 Mar 2026 | £163,000 |
| 18 Oct 2016 | £141,000 |
43, Nightingale Wynd, Springwell, Gateshead NE9 7FE
| Today | See what it's worth now |
| 20 Mar 2026 | £320,000 |
| 27 Jun 2024 | £324,995 |
No other historical records.
14, Musgrave Road, Low Fell, Gateshead NE9 5TA
| Today | See what it's worth now |
| 20 Mar 2026 | £250,000 |
| 25 Aug 2023 | £246,000 |
25, Lynnholme Gardens, Low Fell, Gateshead NE9 5DY
| Today | See what it's worth now |
| 16 Mar 2026 | £246,000 |
| 19 Jun 2020 | £179,950 |
61, Meadow Rise, Beacon Lough, Gateshead NE9 6GB
| Today | See what it's worth now |
| 13 Mar 2026 | £290,000 |
| 28 Jun 2002 | £129,950 |
No other historical records.
46, Dryden Court, Low Fell, Gateshead NE9 5BY
| Today | See what it's worth now |
| 13 Mar 2026 | £63,000 |
| 8 Jul 2016 | £65,000 |
73, Dryden Road, Low Fell, Gateshead NE9 5TR
| Today | See what it's worth now |
| 11 Mar 2026 | £255,000 |
| 1 Jul 2010 | £187,500 |
10, Devon Gardens, Low Fell, Gateshead NE9 5BA
| Today | See what it's worth now |
| 10 Mar 2026 | £445,000 |
| 30 Jan 2001 | £92,000 |
11, Hamsterley Crescent, Wrekenton, Gateshead NE9 7LA
| Today | See what it's worth now |
| 10 Mar 2026 | £119,999 |
No other historical records.
6, Salkeld Gardens, Low Fell, Gateshead NE9 5ED
| Today | See what it's worth now |
| 10 Mar 2026 | £254,550 |
| 27 Jul 2018 | £174,250 |
18, Kendal Crescent, Beacon Lough, Gateshead NE9 6YB
| Today | See what it's worth now |
| 9 Mar 2026 | £175,500 |
| 18 Jan 2019 | £89,000 |
No other historical records.
Source Acknowledgement: © Crown copyright. England and Wales house price data is publicly available information produced by the HM Land Registry.This material was last updated on 9 July 2026. It covers the period from 1 January 1995 to 30 April 2026 and contains property transactions which have been registered during that period. Contains HM Land Registry data © Crown copyright and database right 2026. This data is licensed under the Open Government Licence v3.0.
Disclaimer: Rightmove.co.uk provides this HM Land Registry data "as is". The burden for fitness of the data relies completely with the user and is provided for informational purposes only. No warranty, express or implied, is given relating to the accuracy of content of the HM Land Registry data and Rightmove does not accept any liability for error or omission. If you have found an error with the data or need further information please contact HM Land Registry.
Permitted Use: Viewers of this Information are granted permission to access this Crown copyright material and to download it onto electronic, magnetic, optical or similar storage media provided that such activities are for private research, study or in-house use only. Any other use of the material requires the formal written permission of Land Registry which can be requested from us, and is subject to an additional licence and associated charge.
Rightmove takes no liability for your use of, or reliance on, Rightmove's Instant Valuation due to the limitations of our tracking tool listed here. Use of this tool is taken entirely at your own risk. All rights reserved.