
House Prices in SO19
House prices in SO19 have an overall average of £264,202 over the last year.
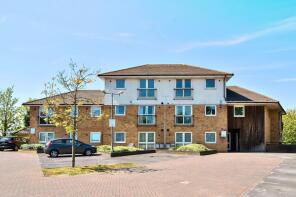
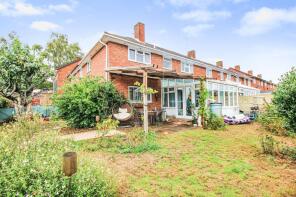
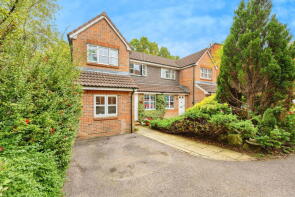
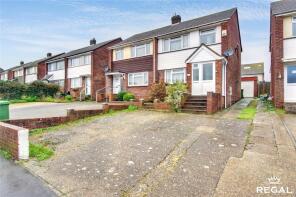
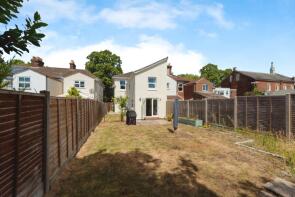
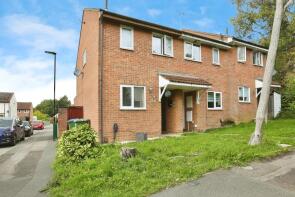
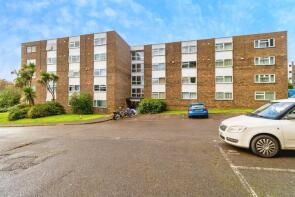
The majority of properties sold in SO19 during the last year were semi-detached properties, selling for an average price of £294,327. Terraced properties sold for an average of £256,815, with flats fetching £159,768.
Overall, the historical sold prices in SO19 over the last year were 1% down on the previous year and similar to the 2022 peak of £263,864.
Properties Sold
2, Penistone Close, Southampton SO19 9HS

| Today | See what it's worth now |
| 24 Apr 2026 | £299,999 |
| 12 Sep 2007 | £204,000 |
No other historical records.
14, Belton Road, Southampton SO19 1DS
| Today | See what it's worth now |
| 24 Apr 2026 | £320,000 |
| 7 Aug 2020 | £270,000 |
No other historical records.
59, Athelstan Road, Southampton SO19 4DE

| Today | See what it's worth now |
| 24 Apr 2026 | £305,000 |
| 1 Aug 2008 | £185,000 |
Extensions and planning permission in SO19
See planning approval stats, extension build costs and value added estimates.

325, Butts Road, Southampton SO19 1BR

| Today | See what it's worth now |
| 17 Apr 2026 | £340,000 |
| 25 Jan 2016 | £229,000 |
43, Valentine Avenue, Southampton SO19 0EQ

| Today | See what it's worth now |
| 15 Apr 2026 | £260,000 |
| 14 Jun 1996 | £56,000 |
No other historical records.
Flat 11, 489 Target Place, Butts Road, Southampton SO19 1AD
| Today | See what it's worth now |
| 14 Apr 2026 | £150,000 |
| 11 Mar 2008 | £62,500 |
No other historical records.
27, Medwall Green, Southampton SO19 6JP
| Today | See what it's worth now |
| 14 Apr 2026 | £305,000 |
| 18 Jun 2004 | £125,000 |
No other historical records.
17a, Hazel Road, Southampton SO19 7GA

| Today | See what it's worth now |
| 14 Apr 2026 | £114,217 |
| 23 Mar 2018 | £282,500 |
No other historical records.
122, Archery Road, Southampton SO19 9GG

| Today | See what it's worth now |
| 14 Apr 2026 | £380,000 |
| 8 Aug 2006 | £200,000 |
No other historical records.
8, Bevan Close, Southampton SO19 9PE
| Today | See what it's worth now |
| 10 Apr 2026 | £303,000 |
| 15 May 2008 | £198,000 |
31, Chadwell Avenue, Southampton SO19 8GE
| Today | See what it's worth now |
| 10 Apr 2026 | £277,000 |
| 24 Aug 2017 | £237,000 |
115, Spring Road, Southampton SO19 2NU
| Today | See what it's worth now |
| 8 Apr 2026 | £335,000 |
| 6 Feb 2008 | £198,500 |
56, Bracklesham Close, Southampton SO19 8TD
| Today | See what it's worth now |
| 7 Apr 2026 | £206,000 |
| 12 Apr 2019 | £156,500 |
31, Porchester Road, Southampton SO19 2JB
| Today | See what it's worth now |
| 7 Apr 2026 | £328,000 |
| 28 Feb 2018 | £260,000 |
19, Staith Close, Southampton SO19 8BL
| Today | See what it's worth now |
| 2 Apr 2026 | £282,000 |
| 23 Nov 2010 | £164,000 |
27, Swift Road, Southampton SO19 9FL

| Today | See what it's worth now |
| 2 Apr 2026 | £252,500 |
| 29 Jun 2022 | £235,000 |
47, Church Road, Southampton SO19 9FR

| Today | See what it's worth now |
| 2 Apr 2026 | £310,000 |
No other historical records.
188, Middle Road, Southampton SO19 8PG
| Today | See what it's worth now |
| 1 Apr 2026 | £260,000 |
| 2 Jun 2017 | £222,500 |
57, The Oaks, Southampton SO19 7RP
| Today | See what it's worth now |
| 31 Mar 2026 | £205,000 |
| 23 Aug 1999 | £48,500 |
5, Coalville Road, Southampton SO19 8GQ
| Today | See what it's worth now |
| 31 Mar 2026 | £275,000 |
| 18 Sep 2017 | £225,000 |
14, Poplar Road, Southampton SO19 7LT

| Today | See what it's worth now |
| 31 Mar 2026 | £270,500 |
| 27 Feb 2019 | £210,000 |
76, Sullivan Road, Southampton SO19 0JL
| Today | See what it's worth now |
| 31 Mar 2026 | £275,000 |
| 28 Jul 2023 | £266,000 |
5, Peartree Road, Southampton SO19 7GU
| Today | See what it's worth now |
| 31 Mar 2026 | £345,000 |
| 9 May 2018 | £282,000 |
Source Acknowledgement: © Crown copyright. England and Wales house price data is publicly available information produced by the HM Land Registry.This material was last updated on 9 July 2026. It covers the period from 1 January 1995 to 30 April 2026 and contains property transactions which have been registered during that period. Contains HM Land Registry data © Crown copyright and database right 2026. This data is licensed under the Open Government Licence v3.0.
Disclaimer: Rightmove.co.uk provides this HM Land Registry data "as is". The burden for fitness of the data relies completely with the user and is provided for informational purposes only. No warranty, express or implied, is given relating to the accuracy of content of the HM Land Registry data and Rightmove does not accept any liability for error or omission. If you have found an error with the data or need further information please contact HM Land Registry.
Permitted Use: Viewers of this Information are granted permission to access this Crown copyright material and to download it onto electronic, magnetic, optical or similar storage media provided that such activities are for private research, study or in-house use only. Any other use of the material requires the formal written permission of Land Registry which can be requested from us, and is subject to an additional licence and associated charge.
Rightmove takes no liability for your use of, or reliance on, Rightmove's Instant Valuation due to the limitations of our tracking tool listed here. Use of this tool is taken entirely at your own risk. All rights reserved.