
House Prices in SO30
House prices in SO30 have an overall average of £360,258 over the last year.
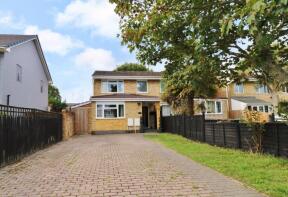
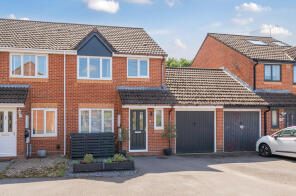
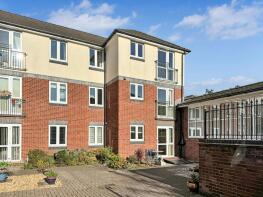
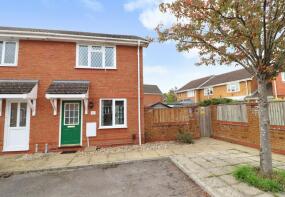
The majority of properties sold in SO30 during the last year were detached properties, selling for an average price of £502,135. Semi-detached properties sold for an average of £352,372, with terraced properties fetching £293,740.
Overall, the historical sold prices in SO30 over the last year were 2% up on the previous year and 5% down on the 2022 peak of £378,559.
Properties Sold
5a, Quob Lane, West End SO30 3GJ
| Today | See what it's worth now |
| 24 Apr 2026 | £215,000 |
| 31 Oct 2025 | £232,500 |
No other historical records.
63, Downscroft Gardens, Southampton SO30 4RS
| Today | See what it's worth now |
| 23 Apr 2026 | £495,000 |
| 12 Jun 2014 | £365,000 |
Flat 32, Fielders Court, Kenilworth Gardens, Southampton SO30 3HH
| Today | See what it's worth now |
| 22 Apr 2026 | £180,000 |
| 11 Dec 2020 | £188,500 |
Extensions and planning permission in SO30
See planning approval stats, extension build costs and value added estimates.

12, Rose Close, Southampton SO30 2GR
| Today | See what it's worth now |
| 21 Apr 2026 | £305,000 |
| 12 Jul 1996 | £64,000 |
No other historical records.
35 Hampton House, Bursledon Road, Southampton SO30 0BP

| Today | See what it's worth now |
| 17 Apr 2026 | £635,000 |
| 6 Feb 2015 | £340,000 |
10, Berrywood Gardens, Southampton SO30 4QZ
| Today | See what it's worth now |
| 17 Apr 2026 | £450,000 |
| 21 Mar 2014 | £320,000 |
No other historical records.
3, Fry Close, Southampton SO30 3LE
| Today | See what it's worth now |
| 17 Apr 2026 | £445,000 |
| 10 Sep 2021 | £430,000 |
No other historical records.
12, Arle Road, Curbridge SO30 2JG
| Today | See what it's worth now |
| 17 Apr 2026 | £460,000 |
| 18 Jan 2024 | £424,000 |
No other historical records.
Flat 26, 64 66 Westwood Court, High Street, Southampton SO30 3DT
| Today | See what it's worth now |
| 16 Apr 2026 | £165,000 |
| 27 Sep 2021 | £137,000 |
12, Arthurs Gardens, Southampton SO30 2NG

| Today | See what it's worth now |
| 16 Apr 2026 | £342,000 |
| 20 Feb 2015 | £270,000 |
1, Spring Gardens, Southampton SO30 0GB
| Today | See what it's worth now |
| 16 Apr 2026 | £290,000 |
| 18 Dec 2015 | £231,000 |
91, Beattie Rise, Southampton SO30 2AG
| Today | See what it's worth now |
| 14 Apr 2026 | £280,000 |
| 28 Apr 2006 | £156,250 |
18, Sharon Road, Southampton SO30 3AS
| Today | See what it's worth now |
| 13 Apr 2026 | £300,000 |
| 28 Mar 2002 | £143,950 |
No other historical records.
13, Runnymede, Southampton SO30 3BG
| Today | See what it's worth now |
| 9 Apr 2026 | £165,500 |
| 8 Oct 2021 | £142,000 |
47, Bamber Close, Southampton SO30 3HW
| Today | See what it's worth now |
| 9 Apr 2026 | £412,500 |
| 9 Mar 2018 | £369,000 |
No other historical records.
1, Coniston Gardens, Southampton SO30 0LP

| Today | See what it's worth now |
| 8 Apr 2026 | £364,950 |
| 26 Aug 2022 | £345,000 |
3, Chichester Close, Southampton SO30 2GQ
| Today | See what it's worth now |
| 7 Apr 2026 | £380,000 |
| 11 Feb 2022 | £310,500 |
27, Collett Close, Southampton SO30 2RR
| Today | See what it's worth now |
| 7 Apr 2026 | £375,000 |
| 15 Apr 2021 | £275,000 |
Flat 46, Fielders Court, Kenilworth Gardens, Southampton SO30 3HH
| Today | See what it's worth now |
| 7 Apr 2026 | £130,000 |
| 31 Aug 2006 | £202,000 |
No other historical records.
34, Wainwright Gardens, Southampton SO30 2NF
| Today | See what it's worth now |
| 2 Apr 2026 | £282,500 |
| 4 Aug 2004 | £170,000 |
142, Stirling Crescent, Southampton SO30 2AL
| Today | See what it's worth now |
| 2 Apr 2026 | £275,000 |
| 13 Jan 2015 | £189,000 |
48, Ferndale, Hedge End SO30 0PP
| Today | See what it's worth now |
| 1 Apr 2026 | £209,000 |
No other historical records.
198, Cranbourne Park, Southampton SO30 0PA
| Today | See what it's worth now |
| 31 Mar 2026 | £325,000 |
| 31 Aug 2006 | £176,000 |
No other historical records.
Source Acknowledgement: © Crown copyright. England and Wales house price data is publicly available information produced by the HM Land Registry.This material was last updated on 9 July 2026. It covers the period from 1 January 1995 to 30 April 2026 and contains property transactions which have been registered during that period. Contains HM Land Registry data © Crown copyright and database right 2026. This data is licensed under the Open Government Licence v3.0.
Disclaimer: Rightmove.co.uk provides this HM Land Registry data "as is". The burden for fitness of the data relies completely with the user and is provided for informational purposes only. No warranty, express or implied, is given relating to the accuracy of content of the HM Land Registry data and Rightmove does not accept any liability for error or omission. If you have found an error with the data or need further information please contact HM Land Registry.
Permitted Use: Viewers of this Information are granted permission to access this Crown copyright material and to download it onto electronic, magnetic, optical or similar storage media provided that such activities are for private research, study or in-house use only. Any other use of the material requires the formal written permission of Land Registry which can be requested from us, and is subject to an additional licence and associated charge.
Rightmove takes no liability for your use of, or reliance on, Rightmove's Instant Valuation due to the limitations of our tracking tool listed here. Use of this tool is taken entirely at your own risk. All rights reserved.