
House Prices in SY12
House prices in SY12 have an overall average of £305,552 over the last year.
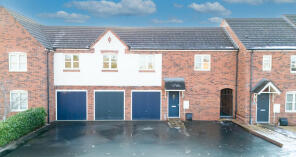
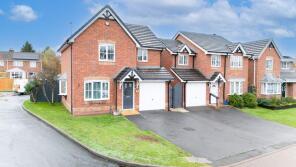
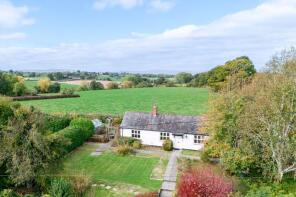
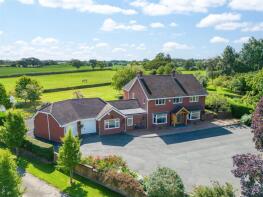
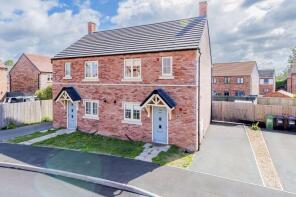
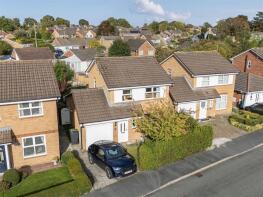
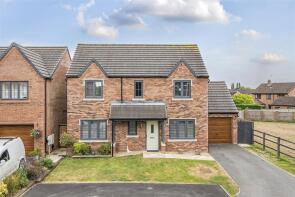
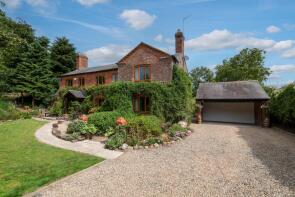
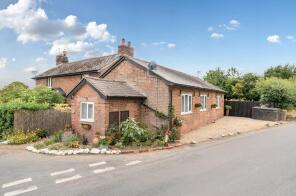
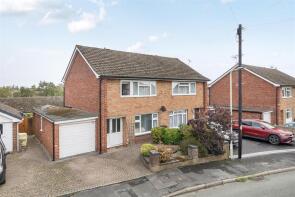
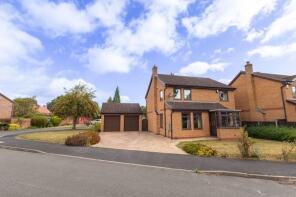
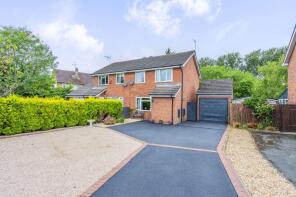
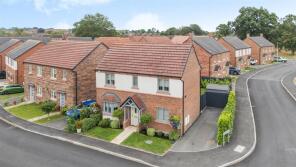
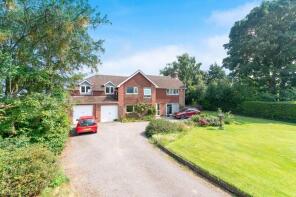
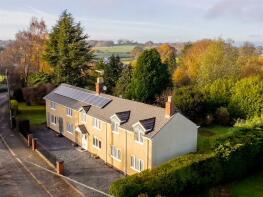
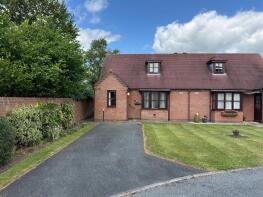
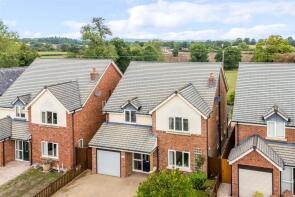
The majority of properties sold in SY12 during the last year were semi-detached properties, selling for an average price of £235,984. Detached properties sold for an average of £379,046, with terraced properties fetching £201,243.
Overall, the historical sold prices in SY12 over the last year were 6% up on the previous year and 5% up on the 2023 peak of £289,700.
Properties Sold
1, New Cottages, Colemere Junction Belgrave Cottages To The Avenue, Colemere, Ellesmere SY12 0QW

| Today | See what it's worth now |
| 9 Apr 2026 | £365,000 |
| 4 Mar 2022 | £292,650 |
No other historical records.
18, Canal Way, Ellesmere SY12 0FE
| Today | See what it's worth now |
| 7 Apr 2026 | £169,995 |
| 31 Jan 2013 | £105,000 |
No other historical records.
2, The Beretuns, Old Marton Crossroads To Perthy Bridge, Ellesmere SY12 9HZ
| Today | See what it's worth now |
| 30 Mar 2026 | £474,000 |
| 28 Jun 2019 | £330,000 |
No other historical records.
Extensions and planning permission in SY12
See planning approval stats, extension build costs and value added estimates.

Anvil House, B5068 From Cross Lanes End To Start Of Elson Road, Ellesmere SY12 9LJ
| Today | See what it's worth now |
| 27 Mar 2026 | £260,000 |
| 29 Mar 2006 | £250,000 |
32, Jebb Court, Dairy Grove, Ellesmere SY12 0GA

| Today | See what it's worth now |
| 20 Mar 2026 | £155,000 |
| 27 Feb 2015 | £179,950 |
No other historical records.
4, Laburnam Drive, Ellesmere SY12 9PL

| Today | See what it's worth now |
| 20 Mar 2026 | £140,000 |
| 16 Sep 2022 | £111,000 |
86, Berwyn View, Ellesmere SY12 0DU
| Today | See what it's worth now |
| 27 Feb 2026 | £183,500 |
| 28 Aug 2020 | £130,000 |
66, Diksmuide Drive, Ellesmere SY12 9QA
| Today | See what it's worth now |
| 27 Feb 2026 | £299,999 |
| 27 Jan 2014 | £170,000 |
90, Oswestry Road, Ellesmere SY12 0EB
| Today | See what it's worth now |
| 27 Feb 2026 | £275,000 |
| 28 Mar 2003 | £59,995 |
No other historical records.
Ivy Cottage, Plas Yolyn Junction To Eastwick Lane Gadlas, Ellesmere SY12 9EB
| Today | See what it's worth now |
| 20 Feb 2026 | £361,000 |
| 28 Apr 1999 | £98,000 |
No other historical records.
Shade Oak, From Trench Villa To Lion Lane Junction, The Trench, Ellesmere SY12 0LR
| Today | See what it's worth now |
| 19 Feb 2026 | £637,500 |
| 30 Aug 2002 | £280,000 |
No other historical records.
19, The Hawthorns, Ellesmere SY12 9ER
| Today | See what it's worth now |
| 16 Feb 2026 | £220,000 |
| 11 Nov 2020 | £175,000 |
No other historical records.
12 The Knowles, Diksmuide Drive, Ellesmere SY12 9QA
| Today | See what it's worth now |
| 13 Feb 2026 | £262,000 |
| 5 Sep 2017 | £185,000 |
2, Aspen Place, Ellesmere SY12 9FE
| Today | See what it's worth now |
| 12 Feb 2026 | £350,000 |
| 25 Sep 2020 | £272,995 |
No other historical records.
The Yews, Colemere Junction Belgrave Cottages To The Avenue, Colemere, Ellesmere SY12 0QW
| Today | See what it's worth now |
| 6 Feb 2026 | £612,500 |
| 28 Sep 1998 | £210,000 |
No other historical records.
Old School Cottage, Lower Hordley Junction To Hordley Junction St Marys Church, Hordley, Ellesmere SY12 9BH
| Today | See what it's worth now |
| 5 Feb 2026 | £225,000 |
| 6 Apr 2022 | £198,000 |
69, Berwyn View, Ellesmere SY12 0DW
| Today | See what it's worth now |
| 30 Jan 2026 | £185,000 |
| 26 Jan 2022 | £170,000 |
4, Almond Drive, Ellesmere SY12 9PS
| Today | See what it's worth now |
| 16 Jan 2026 | £304,995 |
No other historical records.
11, Hillcrest, Ellesmere SY12 0LJ
| Today | See what it's worth now |
| 16 Jan 2026 | £245,000 |
| 17 Nov 2010 | £135,000 |
No other historical records.
2, Wisteria Way, Ellesmere SY12 9FF
| Today | See what it's worth now |
| 16 Jan 2026 | £295,500 |
| 26 Jul 2019 | £214,995 |
No other historical records.
Parkleigh, Ellesmere Road, Ellesmere SY12 9AS
| Today | See what it's worth now |
| 19 Dec 2025 | £79,500 |
| 17 Jun 2025 | £278,150 |
The Church House, Gate House On The A495 To Rowe Lane Junction A495, Ellesmere SY12 0PH
| Today | See what it's worth now |
| 18 Dec 2025 | £405,000 |
| 31 Jul 2000 | £160,500 |
No other historical records.
10, Trimpley Court, Ellesmere SY12 0NY
| Today | See what it's worth now |
| 17 Dec 2025 | £150,000 |
| 29 Apr 2003 | £87,500 |
No other historical records.
Source Acknowledgement: © Crown copyright. England and Wales house price data is publicly available information produced by the HM Land Registry.This material was last updated on 9 July 2026. It covers the period from 1 January 1995 to 30 April 2026 and contains property transactions which have been registered during that period. Contains HM Land Registry data © Crown copyright and database right 2026. This data is licensed under the Open Government Licence v3.0.
Disclaimer: Rightmove.co.uk provides this HM Land Registry data "as is". The burden for fitness of the data relies completely with the user and is provided for informational purposes only. No warranty, express or implied, is given relating to the accuracy of content of the HM Land Registry data and Rightmove does not accept any liability for error or omission. If you have found an error with the data or need further information please contact HM Land Registry.
Permitted Use: Viewers of this Information are granted permission to access this Crown copyright material and to download it onto electronic, magnetic, optical or similar storage media provided that such activities are for private research, study or in-house use only. Any other use of the material requires the formal written permission of Land Registry which can be requested from us, and is subject to an additional licence and associated charge.
Rightmove takes no liability for your use of, or reliance on, Rightmove's Instant Valuation due to the limitations of our tracking tool listed here. Use of this tool is taken entirely at your own risk. All rights reserved.