
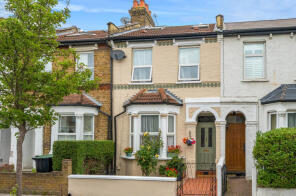
House Prices in South Norwood
House prices in South Norwood have an overall average of £413,481 over the last year.
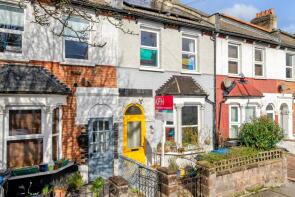
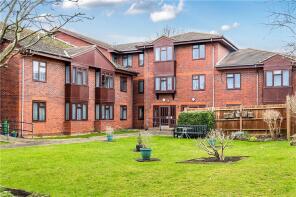
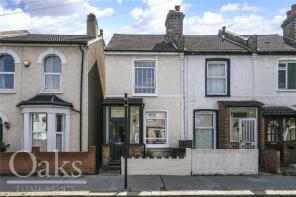
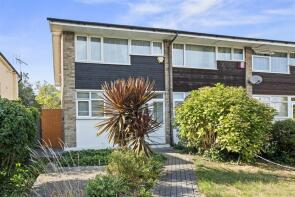
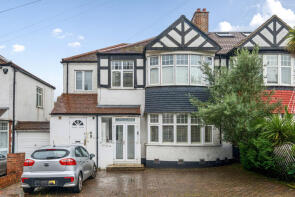
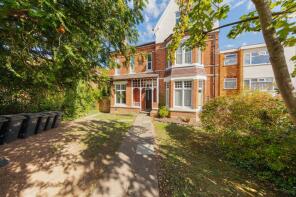
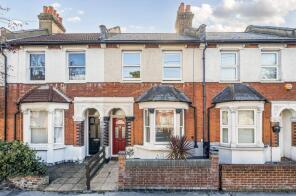
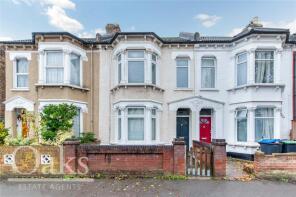
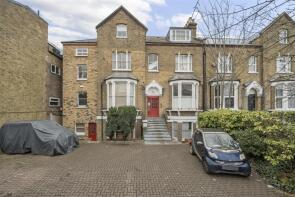
The majority of properties sold in South Norwood during the last year were terraced properties, selling for an average price of £483,583. Flats sold for an average of £288,000, with semi-detached properties fetching £587,081.
Overall, the historical sold prices in South Norwood over the last year were similar to the previous year and 3% up on the 2022 peak of £402,215.
Properties Sold
61, Grasmere Road, South Norwood, London SE25 4RQ
| Today | See what it's worth now |
| 23 Apr 2026 | £480,000 |
| 21 Mar 2022 | £405,000 |
No other historical records.
1, 61 63 Catalina Court, Sunny Bank, South Norwood, London SE25 4TZ
| Today | See what it's worth now |
| 10 Apr 2026 | £95,000 |
| 14 Feb 2023 | £177,000 |
13, Elmers Road, South Norwood, London SE25 5DS
| Today | See what it's worth now |
| 10 Apr 2026 | £406,000 |
| 11 Jul 2019 | £295,000 |
No other historical records.
Flat 11, 22 Pump House, Station Road, South Norwood, London SE25 5FJ

| Today | See what it's worth now |
| 9 Apr 2026 | £320,000 |
| 9 Oct 2020 | £183,000 |
No other historical records.
1, The Maltings, Whitehorse Lane, South Norwood, London SE25 6UJ
| Today | See what it's worth now |
| 8 Apr 2026 | £440,000 |
| 23 Oct 1998 | £80,000 |
No other historical records.
48a, Southern Avenue, South Norwood, London SE25 4BS
| Today | See what it's worth now |
| 7 Apr 2026 | £400,000 |
| 14 Oct 2022 | £372,000 |
15, Pittville Gardens, South Norwood, London SE25 4DJ
| Today | See what it's worth now |
| 31 Mar 2026 | £150,000 |
| 13 Aug 2001 | £140,000 |
No other historical records.
Flat 5, 228, South Norwood Hill, South Norwood, London SE25 6AS
| Today | See what it's worth now |
| 31 Mar 2026 | £310,000 |
| 31 Oct 2003 | £137,000 |
26, Grasmere Road, South Norwood, London SE25 4RD
| Today | See what it's worth now |
| 30 Mar 2026 | £450,000 |
| 30 Nov 2017 | £398,000 |
8, Holmewood Road, South Norwood, London SE25 6UY
| Today | See what it's worth now |
| 27 Mar 2026 | £514,000 |
| 30 Sep 2011 | £210,000 |
No other historical records.
79, Crowther Road, South Norwood, London SE25 5QS

| Today | See what it's worth now |
| 27 Mar 2026 | £495,000 |
| 27 Sep 2024 | £418,000 |
No other historical records.
58, Watcombe Road, South Norwood, London SE25 4UZ
| Today | See what it's worth now |
| 27 Mar 2026 | £500,000 |
No other historical records.
172, Holmesdale Road, South Norwood, London SE25 6PT

| Today | See what it's worth now |
| 25 Mar 2026 | £155,000 |
| 2 Sep 2013 | £215,000 |
No other historical records.
80, Whitehorse Lane, South Norwood, London SE25 6RQ

| Today | See what it's worth now |
| 20 Mar 2026 | £350,000 |
| 9 Dec 2005 | £171,000 |
20, Stroud Road, South Norwood, London SE25 5DR
| Today | See what it's worth now |
| 20 Mar 2026 | £400,000 |
| 6 Nov 2020 | £345,000 |
Flat 3, 28, King's Road, South Norwood, London SE25 4ES

| Today | See what it's worth now |
| 16 Mar 2026 | £250,000 |
| 20 Apr 2021 | £230,000 |
6, Southcote Road, South Norwood, London SE25 4RG
| Today | See what it's worth now |
| 16 Mar 2026 | £650,000 |
| 5 Oct 2018 | £574,999 |
172, Birchanger Road, South Norwood, London SE25 5BQ
| Today | See what it's worth now |
| 16 Mar 2026 | £350,000 |
No other historical records.
13, Huntly Road, South Norwood, London SE25 6QY

| Today | See what it's worth now |
| 13 Mar 2026 | £665,000 |
| 30 Apr 2019 | £400,000 |
No other historical records.
Flat 3, 153, Selhurst Road, South Norwood, London SE25 6LQ
| Today | See what it's worth now |
| 13 Mar 2026 | £207,500 |
| 26 Aug 2014 | £174,000 |
35, Percy Road, South Norwood, London SE25 5NA
| Today | See what it's worth now |
| 12 Mar 2026 | £440,000 |
| 28 Aug 2020 | £415,000 |
5, 22 The Birches, Avenue Road, South Norwood, London SE25 4EF

| Today | See what it's worth now |
| 12 Mar 2026 | £220,000 |
| 12 Mar 2003 | £115,000 |
125, Cobden Road, South Norwood, London SE25 5NU
| Today | See what it's worth now |
| 11 Mar 2026 | £580,000 |
| 27 Nov 2020 | £402,000 |
Source Acknowledgement: © Crown copyright. England and Wales house price data is publicly available information produced by the HM Land Registry.This material was last updated on 9 July 2026. It covers the period from 1 January 1995 to 30 April 2026 and contains property transactions which have been registered during that period. Contains HM Land Registry data © Crown copyright and database right 2026. This data is licensed under the Open Government Licence v3.0.
Disclaimer: Rightmove.co.uk provides this HM Land Registry data "as is". The burden for fitness of the data relies completely with the user and is provided for informational purposes only. No warranty, express or implied, is given relating to the accuracy of content of the HM Land Registry data and Rightmove does not accept any liability for error or omission. If you have found an error with the data or need further information please contact HM Land Registry.
Permitted Use: Viewers of this Information are granted permission to access this Crown copyright material and to download it onto electronic, magnetic, optical or similar storage media provided that such activities are for private research, study or in-house use only. Any other use of the material requires the formal written permission of Land Registry which can be requested from us, and is subject to an additional licence and associated charge.
Rightmove takes no liability for your use of, or reliance on, Rightmove's Instant Valuation due to the limitations of our tracking tool listed here. Use of this tool is taken entirely at your own risk. All rights reserved.